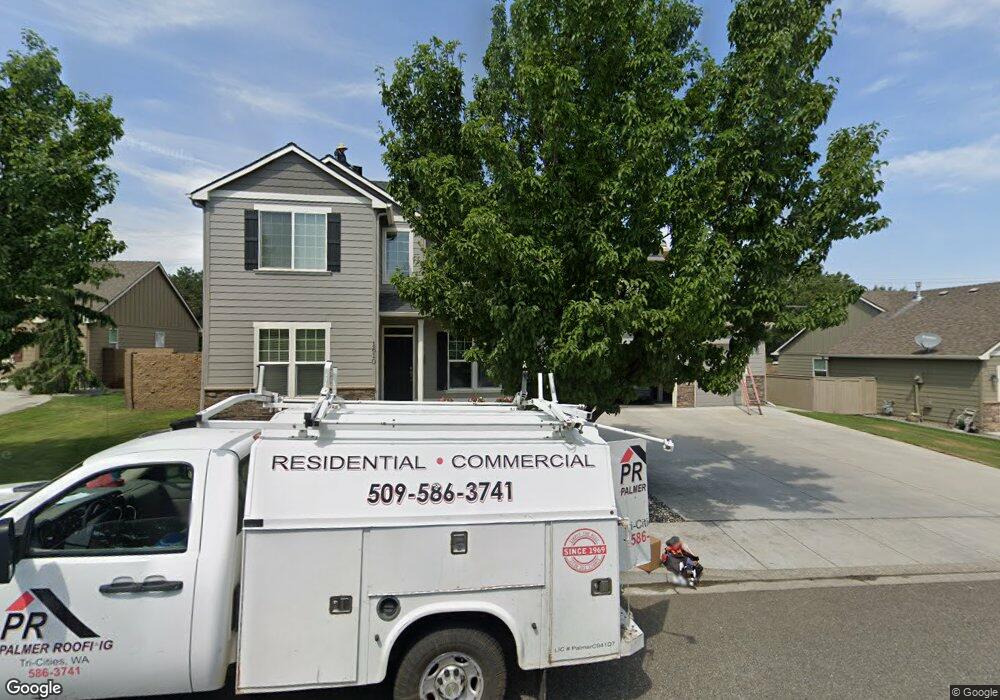
1610 S Jefferson Place Kennewick, WA 99338
Estimated Value: $454,000 - $486,000
3
Beds
3
Baths
2,252
Sq Ft
$211/Sq Ft
Est. Value
About This Home
This home is located at 1610 S Jefferson Place, Kennewick, WA 99338 and is currently estimated at $475,549, approximately $211 per square foot. 1610 S Jefferson Place is a home located in Benton County with nearby schools including Ridge View Elementary School and Southridge High School.
Ownership History
Date
Name
Owned For
Owner Type
Purchase Details
Closed on
Jan 25, 2007
Sold by
Tanninen Construction Inc
Bought by
Hooper Coy S and Hooper Bernadette
Current Estimated Value
Home Financials for this Owner
Home Financials are based on the most recent Mortgage that was taken out on this home.
Original Mortgage
$186,000
Outstanding Balance
$111,034
Interest Rate
6.1%
Mortgage Type
Purchase Money Mortgage
Estimated Equity
$364,515
Purchase Details
Closed on
Aug 30, 2006
Sold by
Nnp Creekstone Llc
Bought by
Tanninen Construction Inc
Home Financials for this Owner
Home Financials are based on the most recent Mortgage that was taken out on this home.
Original Mortgage
$345,600
Interest Rate
9.5%
Mortgage Type
Purchase Money Mortgage
Create a Home Valuation Report for This Property
The Home Valuation Report is an in-depth analysis detailing your home's value as well as a comparison with similar homes in the area
Home Values in the Area
Average Home Value in this Area
Purchase History
| Date | Buyer | Sale Price | Title Company |
|---|---|---|---|
| Hooper Coy S | $232,561 | Frontier Title & Esc | |
| Tanninen Construction Inc | $43,000 | Frontier Title & Esc |
Source: Public Records
Mortgage History
| Date | Status | Borrower | Loan Amount |
|---|---|---|---|
| Open | Hooper Coy S | $186,000 | |
| Previous Owner | Tanninen Construction Inc | $345,600 |
Source: Public Records
Tax History Compared to Growth
Tax History
| Year | Tax Paid | Tax Assessment Tax Assessment Total Assessment is a certain percentage of the fair market value that is determined by local assessors to be the total taxable value of land and additions on the property. | Land | Improvement |
|---|---|---|---|---|
| 2024 | $3,498 | $414,170 | $70,000 | $344,170 |
| 2023 | $3,498 | $437,910 | $70,000 | $367,910 |
| 2022 | $3,005 | $342,960 | $70,000 | $272,960 |
| 2021 | $3,367 | $307,360 | $70,000 | $237,360 |
| 2020 | $3,303 | $334,480 | $46,000 | $288,480 |
| 2019 | $3,019 | $313,880 | $46,000 | $267,880 |
| 2018 | $3,172 | $293,270 | $46,000 | $247,270 |
| 2017 | $2,913 | $252,060 | $46,000 | $206,060 |
| 2016 | $3,355 | $252,060 | $46,000 | $206,060 |
| 2015 | $3,028 | $252,060 | $46,000 | $206,060 |
| 2014 | -- | $223,260 | $42,000 | $181,260 |
| 2013 | -- | $223,260 | $42,000 | $181,260 |
Source: Public Records
Map
Nearby Homes
- 5926 W 16th Ave
- Lot 12, Phase 8 W 20th Ave Unit Lot12
- Lot 11, Phase 8 W 20th Ave Unit Lot11
- Lot 8, Phase 8 W 20th Ave Unit Lot 8
- Lot 7, Phase 8 W 20th Ave Unit Lot 7
- 5805 W 19th Ave
- 6050 W 20th Ave
- 5702 W 23rd Ave
- 5605 W 14th Ave
- 5603 W 15th Ave
- 1102 S Lincoln St
- 1602 S Fillmore St
- 1603 S Fillmore St
- 6009 W 26th Ave
- 1703 S Quay Ct
- 1705 S Edison St
- 1911 S Edison St
- 6109 W 8th Ave
- 800 S Jefferson St Unit Lot 1
- 2409 S Edison St
- 1606 S Jefferson Place Unit Immaculate
- 1606 S Jefferson Place
- 1614 S Jefferson Place
- 1611 S Jefferson Place
- 1602 S Jefferson Place
- 1607 S Jefferson Place Unit Pride of Ownership!
- 1607 S Jefferson Place Unit Perfect condition, c
- 1615 S Jefferson Place
- 1700 S Kellogg St
- 5822 W 17th Ave
- 5818 W 17th Ave
- 1601 S Jefferson Place
- 5812 W 17th Ave
- 5900 W 17th Ave
- 5809 W 16th Ave
- 1530 S Jefferson Place
- 1506 S Kellogg St
- 5810 W 17th Ave
- 5814 W 16th Ave
- 5908 W 16th Ave