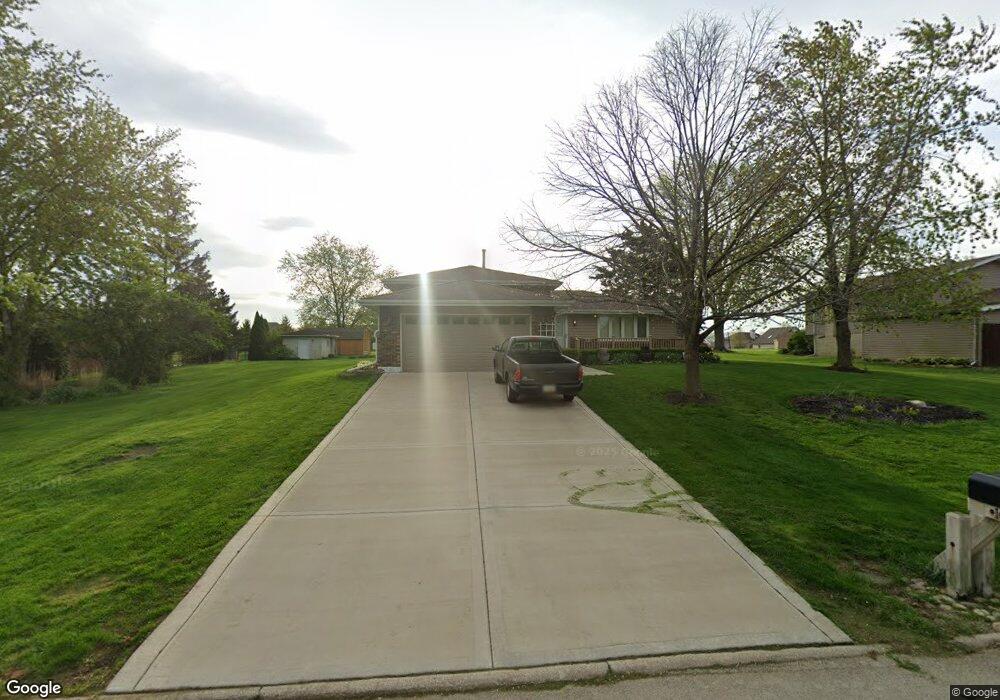
1610 S Regan Rd Unit 3 New Lenox, IL 60451
Estimated Value: $316,979 - $439,000
--
Bed
--
Bath
--
Sq Ft
0.61
Acres
About This Home
This home is located at 1610 S Regan Rd Unit 3, New Lenox, IL 60451 and is currently estimated at $371,245. 1610 S Regan Rd Unit 3 is a home located in Will County with nearby schools including Oster-Oakview School, Haines Elementary School, and Lincoln Way West.
Ownership History
Date
Name
Owned For
Owner Type
Purchase Details
Closed on
Mar 21, 2016
Sold by
Camacho Melecio and Macho Erlinda M
Bought by
Melecio & Erlinda M Camacho Living Trust
Current Estimated Value
Purchase Details
Closed on
Dec 7, 1998
Sold by
Szajkovics Daniel G and Szajkovics Vicki Lynn
Bought by
Camacho Melecio and Camacho Erlinda M
Home Financials for this Owner
Home Financials are based on the most recent Mortgage that was taken out on this home.
Original Mortgage
$132,000
Outstanding Balance
$30,372
Interest Rate
6.93%
Estimated Equity
$340,873
Purchase Details
Closed on
Jun 2, 1994
Sold by
Berndt Edward W and Berndt Laura L
Bought by
Szajkovics Daniel G and Szajkovics Vicki Lynn
Home Financials for this Owner
Home Financials are based on the most recent Mortgage that was taken out on this home.
Original Mortgage
$106,000
Interest Rate
8.48%
Create a Home Valuation Report for This Property
The Home Valuation Report is an in-depth analysis detailing your home's value as well as a comparison with similar homes in the area
Home Values in the Area
Average Home Value in this Area
Purchase History
| Date | Buyer | Sale Price | Title Company |
|---|---|---|---|
| Melecio & Erlinda M Camacho Living Trust | -- | Attorney | |
| Camacho Melecio | $165,000 | -- | |
| Szajkovics Daniel G | $136,000 | -- |
Source: Public Records
Mortgage History
| Date | Status | Borrower | Loan Amount |
|---|---|---|---|
| Open | Camacho Melecio | $132,000 | |
| Previous Owner | Szajkovics Daniel G | $106,000 |
Source: Public Records
Tax History Compared to Growth
Tax History
| Year | Tax Paid | Tax Assessment Tax Assessment Total Assessment is a certain percentage of the fair market value that is determined by local assessors to be the total taxable value of land and additions on the property. | Land | Improvement |
|---|---|---|---|---|
| 2024 | $6,884 | $95,982 | $30,548 | $65,434 |
| 2023 | $6,884 | $87,495 | $27,847 | $59,648 |
| 2022 | $6,223 | $80,604 | $25,654 | $54,950 |
| 2021 | $5,899 | $75,806 | $24,127 | $51,679 |
| 2020 | $5,724 | $73,101 | $23,266 | $49,835 |
| 2019 | $5,470 | $70,835 | $22,545 | $48,290 |
| 2018 | $5,337 | $68,394 | $21,768 | $46,626 |
| 2017 | $5,061 | $66,428 | $21,142 | $45,286 |
| 2016 | $4,907 | $64,650 | $20,576 | $44,074 |
| 2015 | $4,744 | $62,615 | $19,928 | $42,687 |
| 2014 | $4,744 | $61,842 | $19,682 | $42,160 |
| 2013 | $4,744 | $62,675 | $19,947 | $42,728 |
Source: Public Records
Map
Nearby Homes
- 1920 Edmonds Ave
- 1261 S Regan Rd
- 13420 Florence Rd
- 13621 W Maple Rd
- 807 Picardy Place
- 208 Redwood Ave
- 200 Redwood Ave
- 0000 W Regan Rd
- 13741 Elizabeth Ln
- 12001 W Route 6
- 1108 Plaza Dr
- 1344 N Cedar Rd
- 224 Hauser Ct
- 1231 Town Crest Dr Unit E
- 18400 S Parker Rd
- 12932 Carrington Ct
- 217 Aspen Dr
- 18670 S Cornflower Ct
- 821 Chatfield Rd
- Will Cook Rd.+ Southwest Hwy
- 1620 S Regan Rd
- 1606 S Regan Rd
- 1640 S Regan Rd
- 1602 S Regan Rd Unit 3
- 872 Stirrup Ln
- 1607 S Regan Rd
- 1605 S Regan Rd
- 1660 S Regan Rd
- 1514 S Regan Rd
- 12649 S Regan Rd
- 856 Stirrup Ln
- 850 Wagon Dr
- 885 Stirrup Ln
- 1680 S Regan Rd
- 1510 S Regan Rd
- 831 Wagon Dr
- 840 Wagon Dr
- 1605 London Rd
- 842 Stirrup Ln
- 1625 London Rd