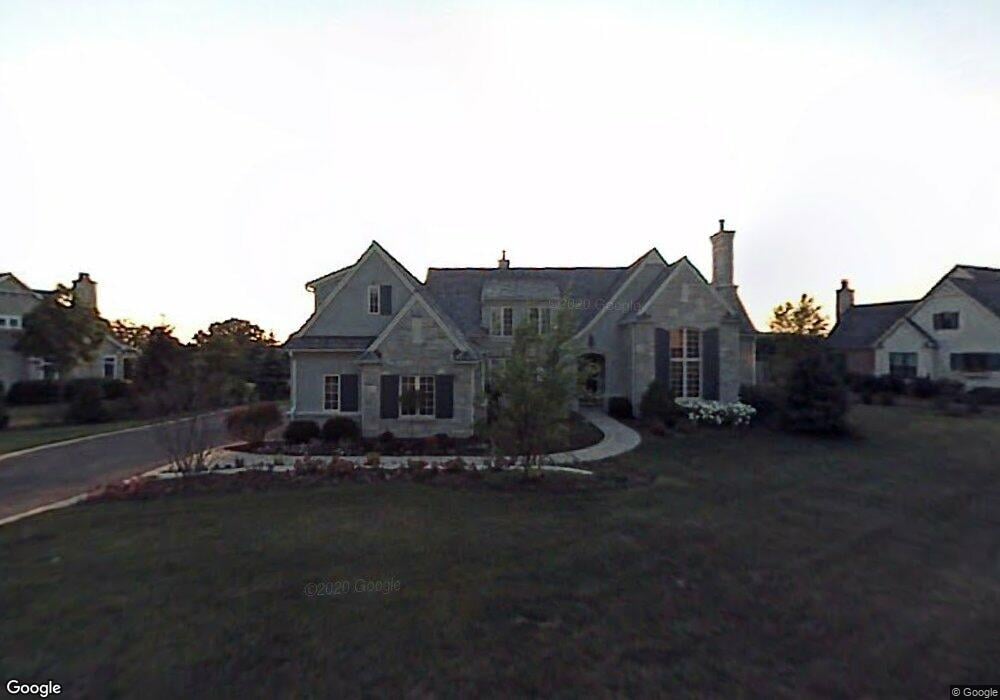
1610 Tallgrass Ln Lake Forest, IL 60045
Estimated Value: $1,681,000 - $1,954,000
--
Bed
6
Baths
4,855
Sq Ft
$368/Sq Ft
Est. Value
About This Home
This home is located at 1610 Tallgrass Ln, Lake Forest, IL 60045 and is currently estimated at $1,786,602, approximately $367 per square foot. 1610 Tallgrass Ln is a home located in Lake County with nearby schools including Everett Elementary School, Deer Path Middle School East, and Lake Forest High School.
Ownership History
Date
Name
Owned For
Owner Type
Purchase Details
Closed on
Dec 8, 2005
Sold by
Wanland Gallery Development Llc
Bought by
Potash Lawrence S and Potash Lisa A
Current Estimated Value
Home Financials for this Owner
Home Financials are based on the most recent Mortgage that was taken out on this home.
Original Mortgage
$1,746,000
Outstanding Balance
$952,364
Interest Rate
5.87%
Mortgage Type
Purchase Money Mortgage
Estimated Equity
$834,238
Purchase Details
Closed on
Mar 31, 2005
Sold by
Wanland Gallery Development Partners
Bought by
Wanland Gallery Development Llc
Purchase Details
Closed on
Apr 1, 2004
Sold by
The Goebeler Co
Bought by
Wanland Gallery Development Partners
Home Financials for this Owner
Home Financials are based on the most recent Mortgage that was taken out on this home.
Original Mortgage
$1,275,000
Interest Rate
4%
Mortgage Type
Construction
Create a Home Valuation Report for This Property
The Home Valuation Report is an in-depth analysis detailing your home's value as well as a comparison with similar homes in the area
Home Values in the Area
Average Home Value in this Area
Purchase History
| Date | Buyer | Sale Price | Title Company |
|---|---|---|---|
| Potash Lawrence S | $2,183,500 | -- | |
| Wanland Gallery Development Llc | -- | -- | |
| Wanland Gallery Development Partners | $725,000 | Metropolitan Title Co |
Source: Public Records
Mortgage History
| Date | Status | Borrower | Loan Amount |
|---|---|---|---|
| Open | Potash Lawrence S | $1,746,000 | |
| Previous Owner | Wanland Gallery Development Partners | $1,275,000 |
Source: Public Records
Tax History Compared to Growth
Tax History
| Year | Tax Paid | Tax Assessment Tax Assessment Total Assessment is a certain percentage of the fair market value that is determined by local assessors to be the total taxable value of land and additions on the property. | Land | Improvement |
|---|---|---|---|---|
| 2024 | $30,223 | $512,869 | $133,364 | $379,505 |
| 2023 | $27,724 | $483,930 | $125,839 | $358,091 |
| 2022 | $27,724 | $463,510 | $120,529 | $342,981 |
| 2021 | $26,904 | $458,512 | $119,229 | $339,283 |
| 2020 | $26,244 | $460,076 | $119,636 | $340,440 |
| 2019 | $25,318 | $458,380 | $119,195 | $339,185 |
| 2018 | $25,207 | $488,276 | $129,575 | $358,701 |
| 2017 | $24,707 | $476,878 | $126,550 | $350,328 |
| 2016 | $23,858 | $456,649 | $121,182 | $335,467 |
| 2015 | $23,427 | $427,054 | $113,328 | $313,726 |
| 2014 | $26,492 | $483,397 | $121,713 | $361,684 |
| 2012 | $25,604 | $484,366 | $121,957 | $362,409 |
Source: Public Records
Map
Nearby Homes
- 1144 Ranch Rd Unit 4
- 1122 S Estate Ln
- 1371 Lakewood Dr
- 1401 W Everett Rd
- 1448 Lawrence Ave
- 1515 Sage Ct
- 660 S Buckingham Ct
- 1352 S Estate Ln
- 1866 S Wilson Dr
- 500 Andover Ct
- 625 Leland Ct
- 1455 Littlefield Ct
- 1280 Lawrence Ave
- 2150 W Saunders Rd
- 1318 Kajer Ln
- 480 Saunders Rd
- 289 S South Shore Ln
- 1181 Gavin Ct
- 600 Riverwoods Rd
- LOT 50 Kajer Ln
- 1620 Tallgrass Ln
- 1600 Tallgrass Ln
- 1605 Tallgrass Ln
- 1615 Tallgrass Ln
- 1630 Tallgrass Ln
- 1595 Tallgrass Ln
- 1590 Tallgrass Ln
- 1625 Tallgrass Ln
- 1635 Tallgrass Ln
- 1640 Tallgrass Ln
- 1655 Tallgrass Ln
- 1650 Tallgrass Ln
- 1765 Tallgrass Ln
- 1775 Tallgrass Ln
- 1755 Tallgrass Ln
- 1745 Tallgrass Ln
- 1700 Tallgrass Ln
- 1690 Tallgrass Ln
- 1735 Tallgrass Ln
- 891 S Southmeadow Ln