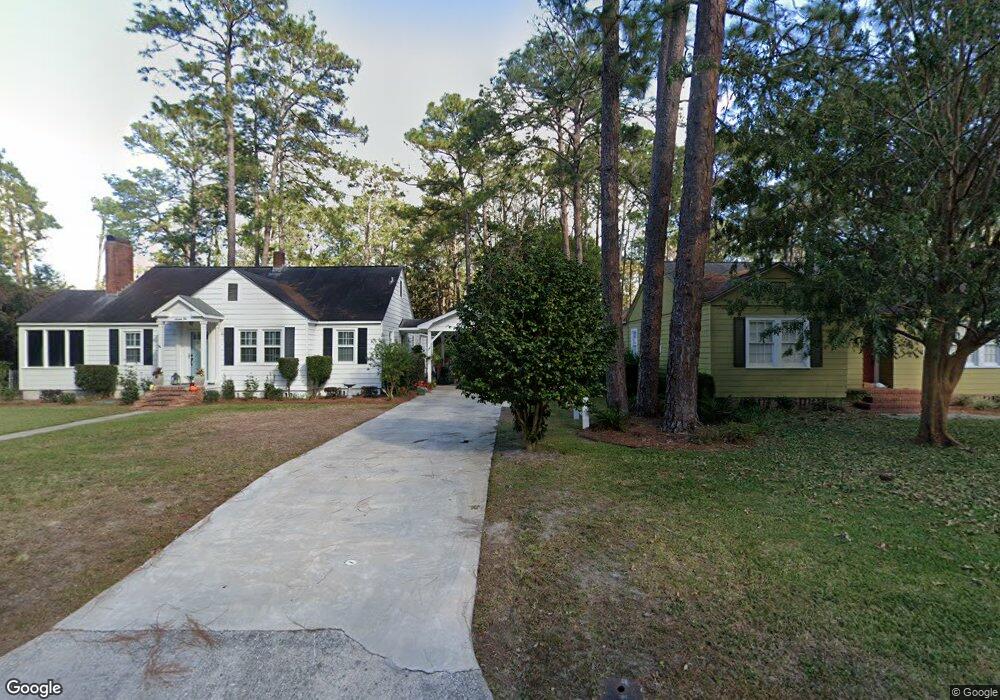
1610 Tupelo Dr Waycross, GA 31501
Estimated Value: $201,000 - $213,000
4
Beds
3
Baths
1,777
Sq Ft
$116/Sq Ft
Est. Value
About This Home
This home is located at 1610 Tupelo Dr, Waycross, GA 31501 and is currently estimated at $206,628, approximately $116 per square foot. 1610 Tupelo Dr is a home located in Ware County with nearby schools including Center Elementary School, Waycross Middle School, and Ware County High School.
Ownership History
Date
Name
Owned For
Owner Type
Purchase Details
Closed on
Feb 14, 2020
Sold by
Peacock Robert C
Bought by
Dicaterino Donna
Current Estimated Value
Home Financials for this Owner
Home Financials are based on the most recent Mortgage that was taken out on this home.
Original Mortgage
$75,000
Outstanding Balance
$59,158
Interest Rate
3.6%
Mortgage Type
New Conventional
Estimated Equity
$147,470
Purchase Details
Closed on
Mar 31, 2009
Sold by
Morris James Robert and Morris Marianne M
Bought by
Peacock Robert C and Dukes Heather B
Home Financials for this Owner
Home Financials are based on the most recent Mortgage that was taken out on this home.
Original Mortgage
$119,759
Interest Rate
5.18%
Mortgage Type
FHA
Purchase Details
Closed on
Dec 22, 2003
Sold by
Morton Carolyn B
Bought by
Norris James R and Norris Marianne M
Purchase Details
Closed on
Mar 26, 1987
Create a Home Valuation Report for This Property
The Home Valuation Report is an in-depth analysis detailing your home's value as well as a comparison with similar homes in the area
Home Values in the Area
Average Home Value in this Area
Purchase History
| Date | Buyer | Sale Price | Title Company |
|---|---|---|---|
| Dicaterino Donna | $110,000 | -- | |
| Peacock Robert C | $122,000 | -- | |
| Norris James R | $109,000 | -- | |
| -- | $52,000 | -- |
Source: Public Records
Mortgage History
| Date | Status | Borrower | Loan Amount |
|---|---|---|---|
| Open | Dicaterino Donna | $75,000 | |
| Previous Owner | Peacock Robert C | $119,759 |
Source: Public Records
Tax History Compared to Growth
Tax History
| Year | Tax Paid | Tax Assessment Tax Assessment Total Assessment is a certain percentage of the fair market value that is determined by local assessors to be the total taxable value of land and additions on the property. | Land | Improvement |
|---|---|---|---|---|
| 2024 | $3,187 | $80,735 | $9,180 | $71,555 |
| 2023 | $2,784 | $60,010 | $3,807 | $56,203 |
| 2022 | $2,392 | $60,010 | $3,807 | $56,203 |
| 2021 | $1,903 | $46,931 | $3,807 | $43,124 |
| 2020 | $1,990 | $45,656 | $3,807 | $41,849 |
| 2019 | $1,624 | $36,728 | $3,807 | $32,921 |
| 2018 | $1,582 | $35,453 | $3,807 | $31,646 |
| 2017 | $1,546 | $35,453 | $3,807 | $31,646 |
| 2016 | $1,546 | $35,453 | $3,807 | $31,646 |
| 2015 | $1,557 | $35,452 | $3,807 | $31,646 |
| 2014 | $1,555 | $35,452 | $3,807 | $31,646 |
| 2013 | -- | $35,452 | $3,806 | $31,645 |
Source: Public Records
Map
Nearby Homes
- 1002 Cherokee Cir
- 1011 Cherokee Cir
- 1001 Coral Rd
- 706 Cherokee Cir
- 1500 Saint Marys Dr
- 907 Euclid Ave
- 1103 Kontz Ave
- Lot 3 City Blvd
- 1715 City Blvd
- 1009 Euclid Ave
- 00 Seminole Trail
- 707 Euclid Ave
- 0 Saint Marys Dr Unit (TRACT 2 0.25 ACRES)
- 1701 Satilla Blvd
- 1100 Euclid Ave
- 1400 E Cherokee Dr
- 2108 Screven Ave
- 1002 Baltimore Ave
- 1205 Dean Dr
- 1621 Camellia Dr
- 1608 Tupelo Dr
- 1614 Tupelo Dr
- 1606 Tupelo Dr
- 1609 Tupelo Dr
- 1613 Tupelo Dr
- 1001 Seminole Trail
- 1611 Dean Dr
- 1613 Dean Dr
- 1005 Seminole Trail
- 909 Seminole Trail
- 906 Cherokee Cir
- 1010 Cherokee Cir
- 1612 Suwanne Dr
- 905 Seminole Trail
- 1606 Suwanne Dr
- 1606 Suwanne Dr
- 1011 Seminole Trail
- 900 Cherokee Cir
- 1602 Suwanne Dr
- 1002 Seminole Trail