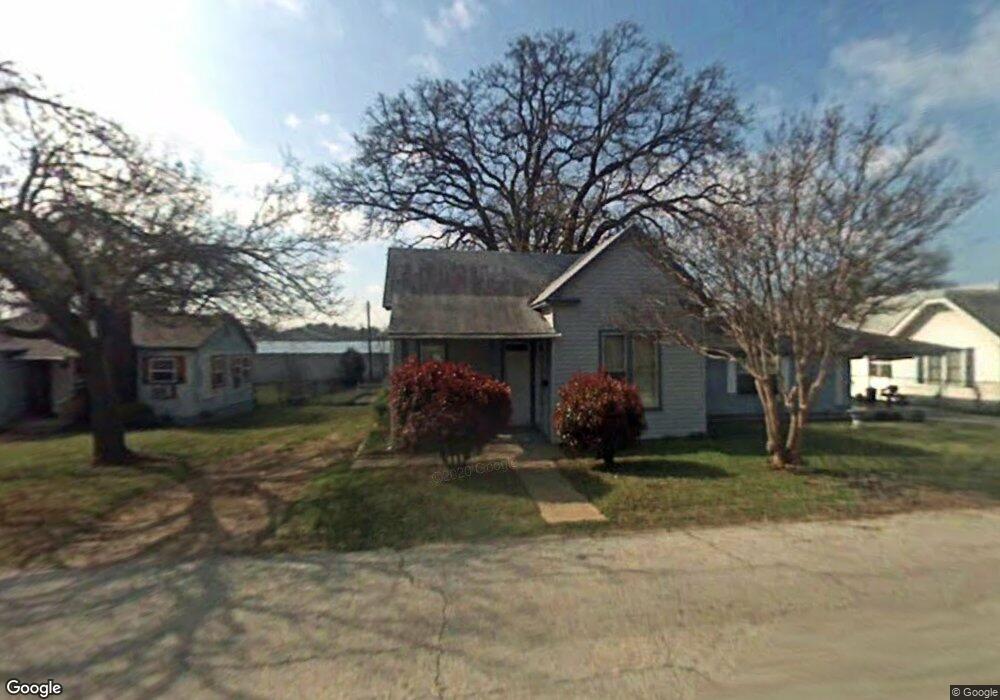
1610 W Bond St Denison, TX 75020
Estimated Value: $120,617 - $169,000
--
Bed
--
Bath
746
Sq Ft
$194/Sq Ft
Est. Value
About This Home
This home is located at 1610 W Bond St, Denison, TX 75020 and is currently estimated at $144,809, approximately $194 per square foot. 1610 W Bond St is a home located in Grayson County with nearby schools including Mayes Elementary School, Scott Middle School, and Denison High School.
Ownership History
Date
Name
Owned For
Owner Type
Purchase Details
Closed on
Jan 30, 2015
Sold by
Marshall Bobby and Marshall Angie
Bought by
Hedrick Samantha
Current Estimated Value
Purchase Details
Closed on
Aug 30, 2008
Sold by
Marshall Bobby M and Marshall Angie
Bought by
Hedrick Samantha
Home Financials for this Owner
Home Financials are based on the most recent Mortgage that was taken out on this home.
Original Mortgage
$39,200
Interest Rate
12%
Mortgage Type
Seller Take Back
Create a Home Valuation Report for This Property
The Home Valuation Report is an in-depth analysis detailing your home's value as well as a comparison with similar homes in the area
Home Values in the Area
Average Home Value in this Area
Purchase History
| Date | Buyer | Sale Price | Title Company |
|---|---|---|---|
| Hedrick Samantha | -- | None Available | |
| Hedrick Samantha | $35,000 | None Available |
Source: Public Records
Mortgage History
| Date | Status | Borrower | Loan Amount |
|---|---|---|---|
| Previous Owner | Hedrick Samantha | $39,200 |
Source: Public Records
Tax History Compared to Growth
Tax History
| Year | Tax Paid | Tax Assessment Tax Assessment Total Assessment is a certain percentage of the fair market value that is determined by local assessors to be the total taxable value of land and additions on the property. | Land | Improvement |
|---|---|---|---|---|
| 2025 | $1,030 | $91,556 | $43,125 | $48,431 |
| 2024 | $2,173 | $93,517 | $0 | $0 |
| 2023 | $886 | $85,015 | $40,875 | $44,140 |
| 2022 | $1,944 | $81,840 | $40,875 | $40,965 |
| 2021 | $1,377 | $54,605 | $20,250 | $34,355 |
| 2020 | $1,320 | $50,044 | $15,000 | $35,044 |
| 2019 | $1,370 | $49,804 | $12,450 | $37,354 |
| 2018 | $1,139 | $41,072 | $7,800 | $33,272 |
| 2017 | $1,075 | $38,425 | $6,975 | $31,450 |
| 2016 | $969 | $34,630 | $4,200 | $30,430 |
| 2015 | $836 | $29,600 | $3,150 | $26,450 |
| 2014 | $761 | $26,955 | $3,150 | $23,805 |
Source: Public Records
Map
Nearby Homes
- 1601 W Bond St
- 2900 W Morton St
- 3130 W Morton St
- 3030 W Morton St
- 1700 W Morton St
- 3300 W Morton St
- 1721 W Walker St Unit A and B
- 1505 W Johnson St
- 1320 W Morton St
- 1609 W Woodard St
- 1309 W Morton St
- 1905 W Morton St Unit 6
- 1905 W Morton St Unit 5
- 1905 W Morton St Unit 17
- 1905 W Morton St Unit 20
- 1905 W Morton St Unit 7
- 1315 W Gandy St
- 1531 W Main St
- 1915 W Bond St
- 916 Leeper Dr
- 1612 W Bond St
- 1604 W Bond St
- 1614 W Bond St
- 1622 W Bond St
- 1626 W Bond St
- 1530 W Bond St
- 1609 W Bond St
- 1605 W Bond St
- 1615 W Bond St
- 1619 W Bond St
- 1630 W Bond St
- 1528 W Bond St
- 1623 W Bond St
- 1631 W Morton St
- 1627 W Bond St
- 1700 W Morton St Unit (Land lease)
- 0.289 W Morton St
- 1531 W Bond St
- 1520 W Bond St
- 602 N Bush Ave