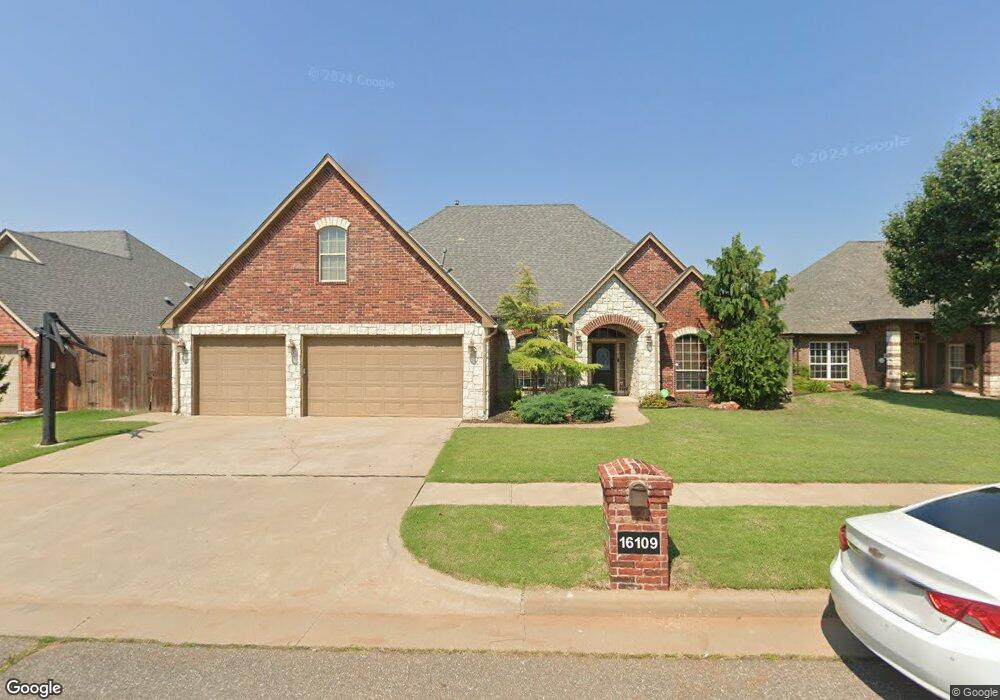
16109 Cattail Cir Edmond, OK 73013
Deer Creek NeighborhoodEstimated Value: $515,213 - $540,000
4
Beds
4
Baths
3,398
Sq Ft
$156/Sq Ft
Est. Value
About This Home
This home is located at 16109 Cattail Cir, Edmond, OK 73013 and is currently estimated at $529,303, approximately $155 per square foot. 16109 Cattail Cir is a home located in Oklahoma County with nearby schools including Deer Creek Elementary School, Deer Creek Intermediate School, and Deer Creek Middle School.
Ownership History
Date
Name
Owned For
Owner Type
Purchase Details
Closed on
Apr 26, 2016
Sold by
Beers Brandin S and Beers Ellen M
Bought by
Beers Brandin S and Beers Ellen M
Current Estimated Value
Purchase Details
Closed on
Dec 5, 2005
Sold by
Isbell Enterprises Inc
Bought by
Beers Brandin S and Beers Ellen
Home Financials for this Owner
Home Financials are based on the most recent Mortgage that was taken out on this home.
Original Mortgage
$251,711
Outstanding Balance
$140,834
Interest Rate
6.29%
Mortgage Type
Fannie Mae Freddie Mac
Estimated Equity
$388,469
Purchase Details
Closed on
May 24, 2005
Sold by
Stillmeadows Llc
Bought by
Isbell Enterprises Inc
Home Financials for this Owner
Home Financials are based on the most recent Mortgage that was taken out on this home.
Original Mortgage
$216,500
Interest Rate
5.87%
Mortgage Type
Construction
Create a Home Valuation Report for This Property
The Home Valuation Report is an in-depth analysis detailing your home's value as well as a comparison with similar homes in the area
Home Values in the Area
Average Home Value in this Area
Purchase History
| Date | Buyer | Sale Price | Title Company |
|---|---|---|---|
| Beers Brandin S | -- | None Available | |
| Beers Brandin S | $322,000 | -- | |
| Isbell Enterprises Inc | $42,500 | First American Title & Tr Co |
Source: Public Records
Mortgage History
| Date | Status | Borrower | Loan Amount |
|---|---|---|---|
| Open | Beers Brandin S | $251,711 | |
| Previous Owner | Isbell Enterprises Inc | $216,500 |
Source: Public Records
Tax History Compared to Growth
Tax History
| Year | Tax Paid | Tax Assessment Tax Assessment Total Assessment is a certain percentage of the fair market value that is determined by local assessors to be the total taxable value of land and additions on the property. | Land | Improvement |
|---|---|---|---|---|
| 2024 | $5,735 | $45,931 | $6,087 | $39,844 |
| 2023 | $5,735 | $44,593 | $5,881 | $38,712 |
| 2022 | $5,510 | $43,295 | $6,964 | $36,331 |
| 2021 | $5,237 | $42,034 | $6,876 | $35,158 |
| 2020 | $5,274 | $40,810 | $6,909 | $33,901 |
| 2019 | $5,188 | $39,655 | $6,881 | $32,774 |
| 2018 | $5,009 | $38,500 | $0 | $0 |
| 2017 | $5,089 | $39,049 | $7,058 | $31,991 |
| 2016 | $4,990 | $38,490 | $6,996 | $31,494 |
| 2015 | $4,764 | $37,369 | $6,440 | $30,929 |
| 2014 | $4,673 | $36,395 | $6,399 | $29,996 |
Source: Public Records
Map
Nearby Homes
- 5813 NW 159th St
- 16205 Scissortail Dr
- 5900 NW 160th St
- 15629 Stillmeadows Dr
- 15633 Stillmeadows Dr
- 15701 Stillmeadows Dr
- 15713 Stillmeadows Dr
- 15709 Stillmeadows Dr
- 15705 Stillmeadows Dr
- 5613 NW 157th St
- 15625 Flora Ave
- 15712 Flora Ave
- 15628 Flora Ave
- 15700 Flora Ave
- 15709 Flora Ave
- 15704 Flora Ave
- 15621 Flora Ave
- 15617 Flora Ave
- 15900 Meadow Rue Ln
- 5205 NW 161st Terrace
- 16113 Cattail Cir
- 16105 Cattail Cir
- 16108 Windrush Place
- 16112 Windrush Place
- 16104 Windrush Place
- 5701 NW 160th St
- 16108 Cattail Cir
- 16117 Cattail Cir
- 16104 Cattail Cir
- 16112 Cattail Cir
- 16116 Windrush Place
- 16121 Cattail Cir
- 5609 NW 160th St
- 16116 Cattail Cir
- 16120 Windrush Place
- 16109 Windrush Place
- 16105 Windrush Place
- 16109 Stillmeadows Dr
- 5708 NW 161st Cir
- 5712 NW 161st Cir