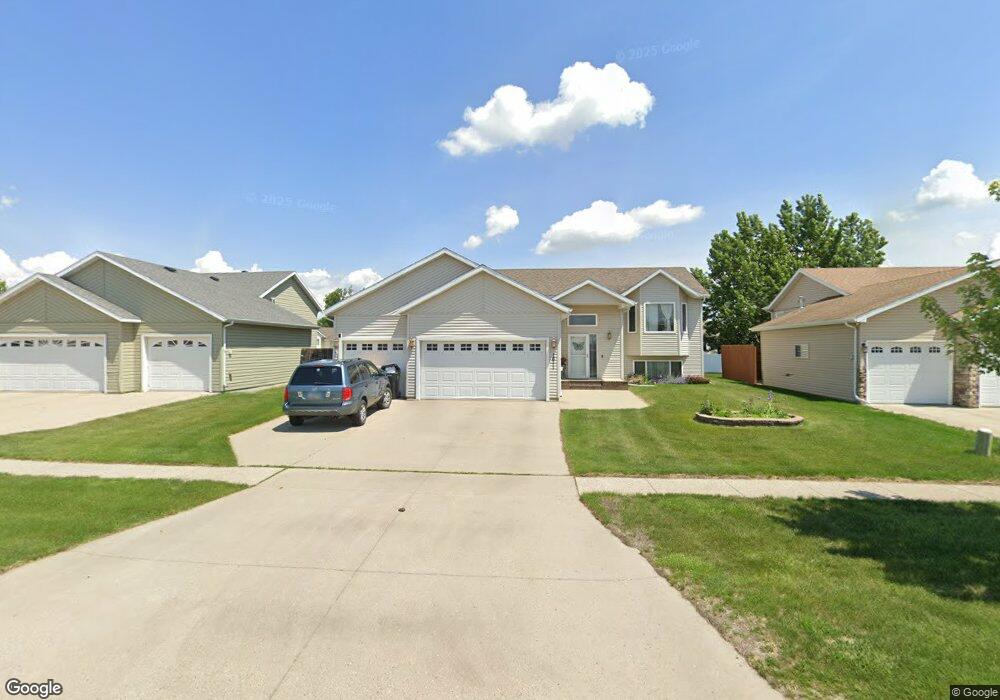
1611 10th St W West Fargo, ND 58078
Elmwood Court NeighborhoodEstimated Value: $386,118 - $396,000
3
Beds
2
Baths
2,200
Sq Ft
$178/Sq Ft
Est. Value
About This Home
This home is located at 1611 10th St W, West Fargo, ND 58078 and is currently estimated at $391,059, approximately $177 per square foot. 1611 10th St W is a home located in Cass County with nearby schools including Westside Elementary School, Cheney Middle School, and West Fargo High School.
Ownership History
Date
Name
Owned For
Owner Type
Purchase Details
Closed on
Feb 9, 2007
Sold by
Gmac Global Relocation Services Inc
Bought by
Denman Jason J and Denman Sandra L
Current Estimated Value
Home Financials for this Owner
Home Financials are based on the most recent Mortgage that was taken out on this home.
Original Mortgage
$138,240
Outstanding Balance
$83,076
Interest Rate
6.22%
Mortgage Type
New Conventional
Estimated Equity
$307,983
Purchase Details
Closed on
Oct 10, 2006
Sold by
Carlson Joshua G and Carlson Jennifer M
Bought by
Gmac Global Relocation Services Inc
Home Financials for this Owner
Home Financials are based on the most recent Mortgage that was taken out on this home.
Original Mortgage
$34,621
Interest Rate
6.23%
Mortgage Type
Unknown
Purchase Details
Closed on
Sep 19, 2005
Sold by
Royal Builders Inc
Bought by
Carlson Joshua G and Carlson Jennifer M
Home Financials for this Owner
Home Financials are based on the most recent Mortgage that was taken out on this home.
Original Mortgage
$161,791
Interest Rate
6.01%
Mortgage Type
New Conventional
Purchase Details
Closed on
Feb 16, 2005
Sold by
Cash Services Llc
Bought by
Royal Builders Inc
Home Financials for this Owner
Home Financials are based on the most recent Mortgage that was taken out on this home.
Original Mortgage
$100,000
Interest Rate
6%
Mortgage Type
Future Advance Clause Open End Mortgage
Create a Home Valuation Report for This Property
The Home Valuation Report is an in-depth analysis detailing your home's value as well as a comparison with similar homes in the area
Home Values in the Area
Average Home Value in this Area
Purchase History
| Date | Buyer | Sale Price | Title Company |
|---|---|---|---|
| Denman Jason J | -- | -- | |
| Gmac Global Relocation Services Inc | -- | -- | |
| Carlson Joshua G | -- | -- | |
| Royal Builders Inc | -- | -- |
Source: Public Records
Mortgage History
| Date | Status | Borrower | Loan Amount |
|---|---|---|---|
| Open | Denman Jason J | $138,240 | |
| Previous Owner | Gmac Global Relocation Services Inc | $34,621 | |
| Previous Owner | Carlson Joshua G | $161,791 | |
| Previous Owner | Royal Builders Inc | $100,000 |
Source: Public Records
Tax History Compared to Growth
Tax History
| Year | Tax Paid | Tax Assessment Tax Assessment Total Assessment is a certain percentage of the fair market value that is determined by local assessors to be the total taxable value of land and additions on the property. | Land | Improvement |
|---|---|---|---|---|
| 2024 | $4,215 | $161,750 | $23,000 | $138,750 |
| 2023 | $4,637 | $158,700 | $23,000 | $135,700 |
| 2022 | $4,550 | $149,200 | $23,000 | $126,200 |
| 2021 | $4,408 | $135,400 | $18,400 | $117,000 |
| 2020 | $4,070 | $128,100 | $18,400 | $109,700 |
| 2019 | $3,834 | $124,150 | $18,400 | $105,750 |
| 2018 | $3,716 | $125,300 | $18,400 | $106,900 |
| 2017 | $3,631 | $125,400 | $18,400 | $107,000 |
| 2016 | $3,242 | $122,500 | $18,400 | $104,100 |
| 2015 | $2,811 | $95,400 | $12,600 | $82,800 |
| 2014 | $2,764 | $89,150 | $12,600 | $76,550 |
| 2013 | $2,634 | $86,900 | $12,600 | $74,300 |
Source: Public Records
Map
Nearby Homes
- 1617 10th St W
- 1605 10th St W
- 889 16th Avenue Ct W
- 883 16th Avenue Ct W
- 1007 Oak Place
- 877 16th Avenue Ct W
- 1629 10th St W
- 1063 Oak Place
- 1011 Oak Place
- 871 16th Avenue Ct W
- 1067 Oak Place
- 1015 Oak Place
- 934 16th Ave W
- 1635 10th St W
- 928 16th Ave W
- 916 16th Ave W
- 922 16th Ave W
- 1071 Oak Place
- 910 16th Ave W
- 1019 Oak Place