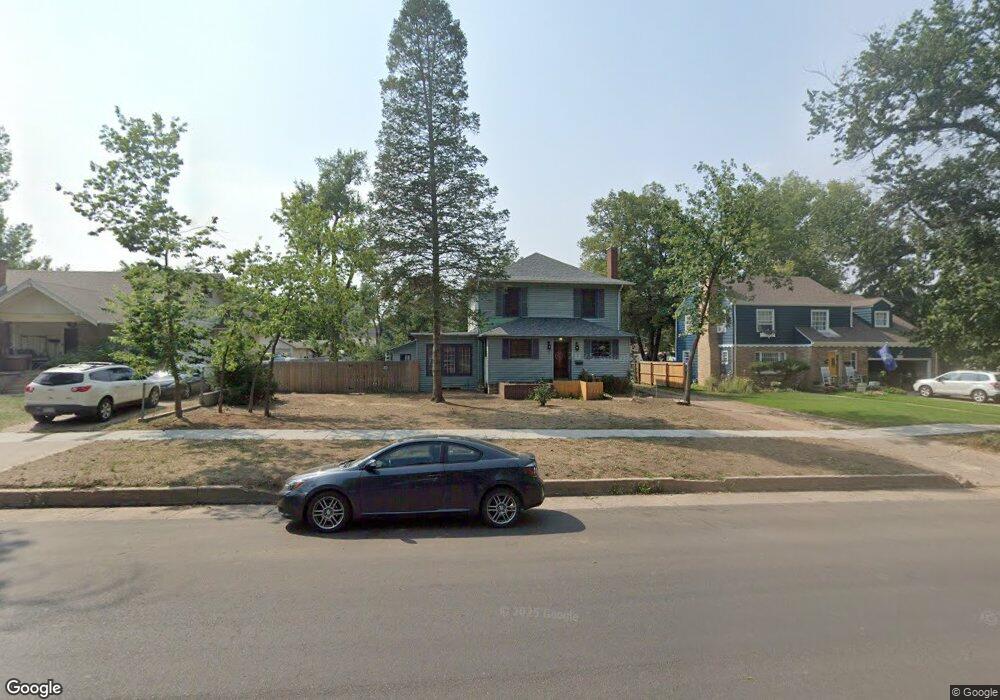
1611 12th Ave Greeley, CO 80631
Cranford NeighborhoodEstimated Value: $384,000 - $612,000
Studio
3
Baths
2,531
Sq Ft
$192/Sq Ft
Est. Value
About This Home
This home is located at 1611 12th Ave, Greeley, CO 80631 and is currently estimated at $485,466, approximately $191 per square foot. 1611 12th Ave is a home located in Weld County with nearby schools including Maplewood Elementary School, Heath Middle School, and Greeley Central High School.
Ownership History
Date
Name
Owned For
Owner Type
Purchase Details
Closed on
Jan 17, 2026
Sold by
Ghofrani Justin and Thompson Margaret Cain
Bought by
Savig House Llc
Current Estimated Value
Purchase Details
Closed on
Apr 4, 2019
Sold by
The Saving Family Trust
Bought by
Savig Vanora L
Purchase Details
Closed on
Aug 17, 1999
Sold by
Savig Norman I
Bought by
Savig Norman I and Savig Ruth E
Purchase Details
Closed on
Apr 29, 1998
Sold by
Savig Norman I and Savig Ruth E
Bought by
Savig Norman I
Home Financials for this Owner
Home Financials are based on the most recent Mortgage that was taken out on this home.
Original Mortgage
$50,600
Interest Rate
7.09%
Create a Home Valuation Report for This Property
The Home Valuation Report is an in-depth analysis detailing your home's value as well as a comparison with similar homes in the area
Home Values in the Area
Average Home Value in this Area
Purchase History
| Date | Buyer | Sale Price | Title Company |
|---|---|---|---|
| Savig House Llc | -- | None Listed On Document | |
| Savig Vanora L | -- | None Available | |
| Savig Norman I | -- | -- | |
| Savig Norman I | -- | -- |
Source: Public Records
Mortgage History
| Date | Status | Borrower | Loan Amount |
|---|---|---|---|
| Previous Owner | Savig Norman I | $50,600 |
Source: Public Records
Tax History
| Year | Tax Paid | Tax Assessment Tax Assessment Total Assessment is a certain percentage of the fair market value that is determined by local assessors to be the total taxable value of land and additions on the property. | Land | Improvement |
|---|---|---|---|---|
| 2025 | $3,029 | $34,680 | $7,600 | $27,080 |
| 2024 | $3,029 | $34,680 | $7,600 | $27,080 |
| 2023 | $2,889 | $39,790 | $8,230 | $31,560 |
| 2022 | $2,589 | $29,690 | $6,300 | $23,390 |
| 2021 | $2,727 | $31,190 | $6,630 | $24,560 |
| 2020 | $2,493 | $28,600 | $5,430 | $23,170 |
| 2019 | $2,500 | $28,600 | $5,430 | $23,170 |
| 2018 | $2,019 | $24,380 | $5,030 | $19,350 |
| 2017 | $1,431 | $24,380 | $5,030 | $19,350 |
| 2016 | $1,216 | $23,380 | $4,480 | $18,900 |
| 2015 | $1,212 | $23,380 | $4,480 | $18,900 |
| 2014 | $1,024 | $13,550 | $4,480 | $9,070 |
Source: Public Records
Map
Nearby Homes
Your Personal Tour Guide
Ask me questions while you tour the home.