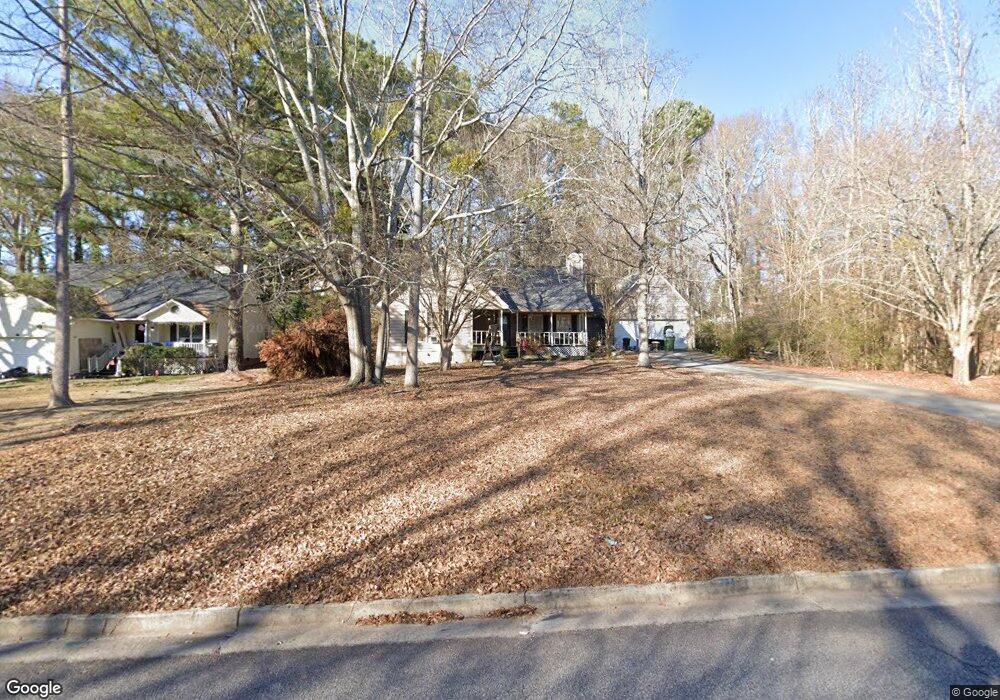
1611 Carriage Hills Dr Griffin, GA 30224
Spalding County NeighborhoodEstimated Value: $218,000 - $246,000
3
Beds
2
Baths
1,432
Sq Ft
$162/Sq Ft
Est. Value
About This Home
This home is located at 1611 Carriage Hills Dr, Griffin, GA 30224 and is currently estimated at $231,695, approximately $161 per square foot. 1611 Carriage Hills Dr is a home located in Spalding County with nearby schools including Orrs Elementary School, Carver Road Middle School, and Griffin High School.
Ownership History
Date
Name
Owned For
Owner Type
Purchase Details
Closed on
Jul 2, 2010
Sold by
Hud-Housing Of Urban Dev
Bought by
Burt Rosa J
Current Estimated Value
Home Financials for this Owner
Home Financials are based on the most recent Mortgage that was taken out on this home.
Original Mortgage
$64,846
Outstanding Balance
$44,737
Interest Rate
5.5%
Mortgage Type
FHA
Estimated Equity
$186,958
Purchase Details
Closed on
Oct 6, 2009
Sold by
Wells Fargo Bk Na
Bought by
Hud-Housing Of Urban Dev
Purchase Details
Closed on
Jul 24, 2001
Sold by
Williams Terry B and Williams Janet E
Bought by
Mcgee Geraldine H
Home Financials for this Owner
Home Financials are based on the most recent Mortgage that was taken out on this home.
Original Mortgage
$117,384
Interest Rate
7.08%
Mortgage Type
FHA
Purchase Details
Closed on
Jan 25, 1989
Sold by
Evans Jack
Bought by
Williams Terry B and Janet Elaine
Purchase Details
Closed on
Aug 23, 1988
Sold by
Landrum & Morris Inc
Bought by
Evans Jack
Create a Home Valuation Report for This Property
The Home Valuation Report is an in-depth analysis detailing your home's value as well as a comparison with similar homes in the area
Home Values in the Area
Average Home Value in this Area
Purchase History
| Date | Buyer | Sale Price | Title Company |
|---|---|---|---|
| Burt Rosa J | -- | -- | |
| Hud-Housing Of Urban Dev | -- | -- | |
| Wells Fargo Bk Na | $119,098 | -- | |
| Mcgee Geraldine H | $119,300 | -- | |
| Williams Terry B | $82,900 | -- | |
| Evans Jack | -- | -- |
Source: Public Records
Mortgage History
| Date | Status | Borrower | Loan Amount |
|---|---|---|---|
| Open | Burt Rosa J | $64,846 | |
| Previous Owner | Mcgee Geraldine H | $117,384 |
Source: Public Records
Tax History Compared to Growth
Tax History
| Year | Tax Paid | Tax Assessment Tax Assessment Total Assessment is a certain percentage of the fair market value that is determined by local assessors to be the total taxable value of land and additions on the property. | Land | Improvement |
|---|---|---|---|---|
| 2024 | $1,785 | $66,510 | $9,200 | $57,310 |
| 2023 | $1,785 | $63,138 | $9,200 | $53,938 |
| 2022 | $1,649 | $55,820 | $8,000 | $47,820 |
| 2021 | $1,958 | $54,706 | $7,200 | $47,506 |
| 2020 | $1,272 | $37,543 | $7,200 | $30,343 |
| 2019 | $1,066 | $31,908 | $7,200 | $24,708 |
| 2018 | $1,064 | $30,965 | $7,200 | $23,765 |
| 2017 | $987 | $29,777 | $7,200 | $22,577 |
| 2016 | $786 | $24,628 | $7,200 | $17,428 |
| 2015 | $799 | $24,628 | $7,200 | $17,428 |
| 2014 | $820 | $24,628 | $7,200 | $17,428 |
Source: Public Records
Map
Nearby Homes
- 1740 Summerwoods Ln
- 450 Carver
- 1611 Piedmont Rd
- 1663 Piedmont Rd
- 424 S Pine Hill Rd Unit 1
- 1169 W Poplar St
- 203 Ashley Dr
- 1723 Carrington Dr
- 1721 Carrington Dr
- 1707 Carrington Dr
- 1705 Carrington Dr
- 1850 Carrington Dr
- 117 Mixon St
- 1326 Oakdale Dr
- 450 Carver Rd
- 1610 Williamson Rd
- 711 S Pine Hill Rd
- 733 S Pine Hill Rd
- TRACT A Newnan Rd
- 1776 Cheryl Ave
- 1613 Carriage Hills Dr
- 1607 Carriage Hills Dr Unit 2
- 1610 Pinebrook Dr
- 1615 Carriage Hills Dr
- 1612 Pinebrook Dr
- 1612 Carriage Hills Dr
- 1606 Pinebrook Dr
- 1614 Carriage Hills Dr
- 1610 Carriage Hills Dr
- 1605 Carriage Hills Dr
- 0 Pinebrook Dr Unit 7492137
- 0 Pinebrook Dr Unit 7103933
- 0 Pinebrook Dr Unit 3277947
- 0 Pinebrook Dr Unit 8346406
- 0 Pinebrook Dr Unit 8339757
- 0 Pinebrook Dr Unit 8130485
- 0 Pinebrook Dr Unit 7617611
- 0 Pinebrook Dr Unit 3235836
- 0 Pinebrook Dr
- 1617 Carriage Hills Dr