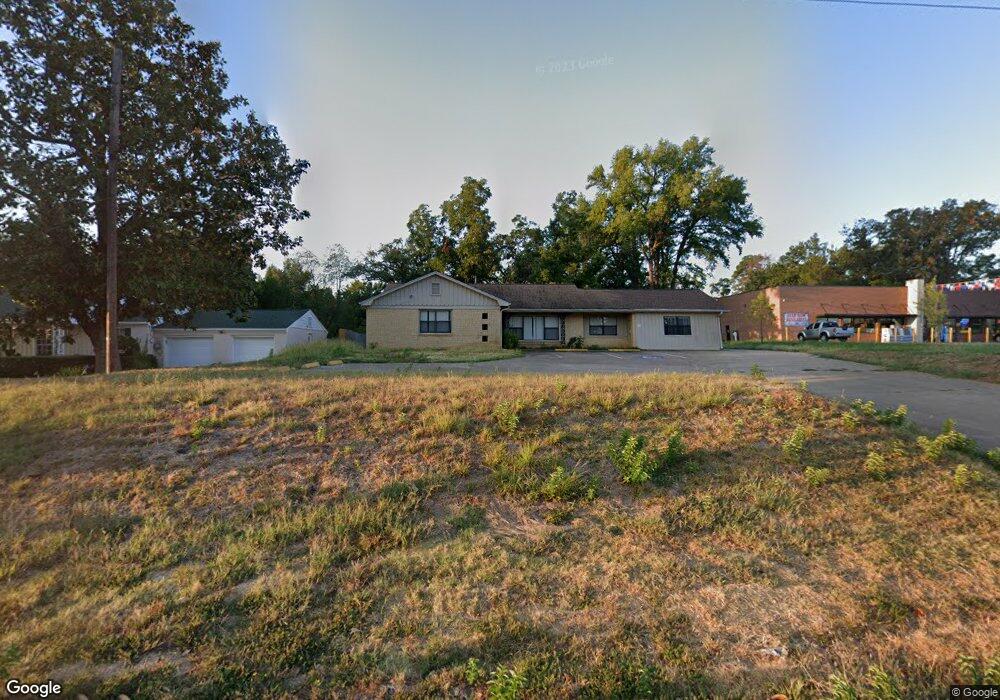
1611 E 5th St Tyler, TX 75701
Midtown Tyler NeighborhoodEstimated Value: $233,000
Studio
2
Baths
1,679
Sq Ft
$139/Sq Ft
Est. Value
About This Home
This home is located at 1611 E 5th St, Tyler, TX 75701 and is currently priced at $233,000, approximately $138 per square foot. 1611 E 5th St is a home located in Smith County with nearby schools including Bell Elementary School, Hubbard Middle School, and Tyler Legacy High School.
Ownership History
Date
Name
Owned For
Owner Type
Purchase Details
Closed on
Apr 9, 2024
Sold by
Super Diamond Eagle Inc
Bought by
Crv Holdings Llc
Current Estimated Value
Home Financials for this Owner
Home Financials are based on the most recent Mortgage that was taken out on this home.
Original Mortgage
$365,500
Outstanding Balance
$356,380
Interest Rate
6.94%
Mortgage Type
New Conventional
Purchase Details
Closed on
Jan 26, 2022
Sold by
Hast Patrick J
Bought by
Super Diamond Eagle Inc
Purchase Details
Closed on
Sep 6, 2018
Sold by
Mj Carson Investments Llc
Bought by
Hast Patrick J
Purchase Details
Closed on
Feb 28, 2011
Sold by
Carson Michael J and Carson Shirley F
Bought by
M J Carson Investments Llc
Purchase Details
Closed on
Dec 28, 2010
Sold by
Redman Richard R and Redman Laura L
Bought by
Carson Michael J and Carson Shirley F
Home Financials for this Owner
Home Financials are based on the most recent Mortgage that was taken out on this home.
Original Mortgage
$191,700
Interest Rate
5.25%
Mortgage Type
New Conventional
Create a Home Valuation Report for This Property
The Home Valuation Report is an in-depth analysis detailing your home's value as well as a comparison with similar homes in the area
Home Values in the Area
Average Home Value in this Area
Purchase History
| Date | Buyer | Sale Price | Title Company |
|---|---|---|---|
| Crv Holdings Llc | -- | None Listed On Document | |
| Super Diamond Eagle Inc | -- | Casey H Cross | |
| Hast Patrick J | -- | None Available | |
| M J Carson Investments Llc | -- | None Available | |
| M J Carson Investments Llc | -- | None Available | |
| Carson Michael J | -- | None Available | |
| Carson Michael J | -- | None Available |
Source: Public Records
Mortgage History
| Date | Status | Borrower | Loan Amount |
|---|---|---|---|
| Open | Crv Holdings Llc | $365,500 | |
| Previous Owner | Carson Michael J | $191,700 | |
| Closed | M J Carson Investments Llc | $0 |
Source: Public Records
Tax History
| Year | Tax Paid | Tax Assessment Tax Assessment Total Assessment is a certain percentage of the fair market value that is determined by local assessors to be the total taxable value of land and additions on the property. | Land | Improvement |
|---|---|---|---|---|
| 2025 | $4,711 | $390,840 | $78,016 | $312,824 |
| 2024 | $4,711 | $276,915 | $78,016 | $198,899 |
| 2023 | $4,864 | $279,049 | $78,016 | $201,033 |
| 2022 | $4,095 | $209,025 | $60,679 | $148,346 |
| 2021 | $4,420 | $210,680 | $60,679 | $150,001 |
| 2020 | $4,572 | $213,648 | $60,679 | $152,969 |
| 2019 | $4,708 | $215,303 | $60,679 | $154,624 |
| 2018 | $4,176 | $192,017 | $52,011 | $140,006 |
| 2017 | $4,131 | $193,490 | $52,011 | $141,479 |
| 2016 | $4,131 | $193,490 | $52,011 | $141,479 |
| 2015 | $4,174 | $194,964 | $52,011 | $142,953 |
| 2014 | $4,174 | $196,438 | $52,011 | $144,427 |
Source: Public Records
Map
Nearby Homes
- 1973 Highland Park
- 1709 Edgewood Dr
- 2015 E 5th St
- 1520 Clubview Dr
- 1914 Parklen St
- 1126 E 8th St
- 2106 Magnolia Dr
- 2200 Airline Dr
- 912 S Palmer Ave
- 1226 S Fleishel Ave
- 1913 Parkway Place
- 1118 S Fleishel Ave
- 837 S Palmer Ave
- 937 Magnolia Dr
- 2308 Lingner Dr
- 2210 Homestead Ln
- 2215 Homestead Ln
- 1022 Troup Hwy
- 2313 Dietz Ln
- 2515 Preston Ave
- 1619 E 5th St
- 1536 E Hankerson St
- 1532 E Hankerson St
- 1621 E 5th St
- 1528 E Hankerson St
- 1532 1532 Hankerson
- 1540 E Hankerson St
- 1527 E 5th St
- 1528 1528 Hankerson
- 1524 E Hankerson St
- 1603 E 5th St
- 1524 1524 E Hankerson
- 1701 E 5th St
- 1520 E Hankerson St
- 1700 S Mahon Ave
- 1539 E Hankerson St
- 1519 E 5th St
- 1516 1516 Hankerson
- 1703 S Mahon Ave
- 1728 E Hankerson St
Your Personal Tour Guide
Ask me questions while you tour the home.