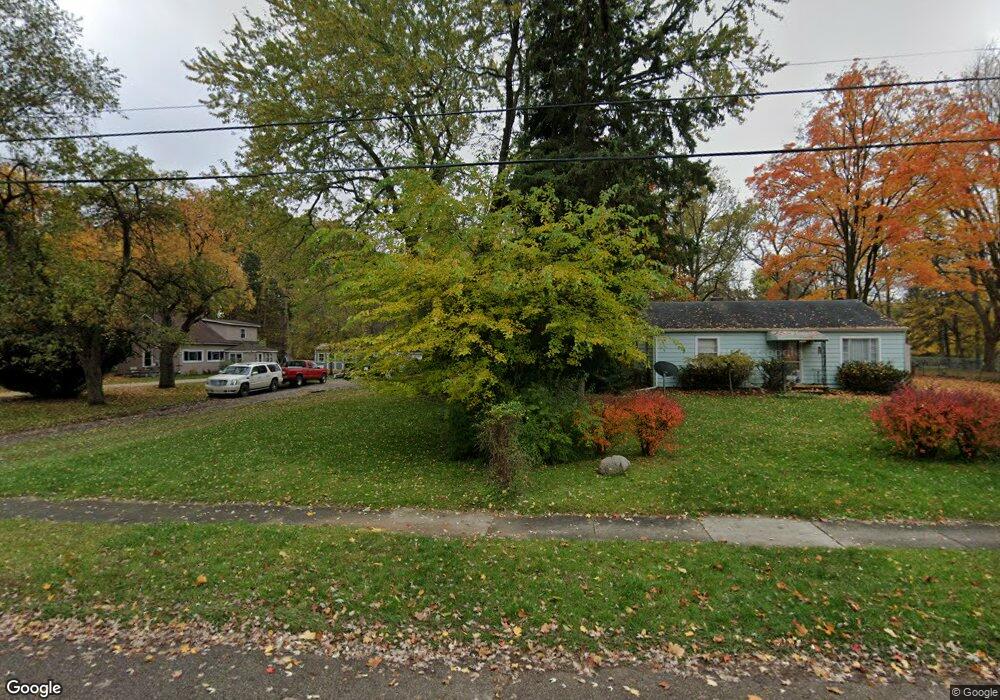
1611 Hillcrest St Lansing, MI 48910
Pleasant Grove NeighborhoodEstimated Value: $89,807 - $139,000
2
Beds
1
Bath
891
Sq Ft
$123/Sq Ft
Est. Value
About This Home
This home is located at 1611 Hillcrest St, Lansing, MI 48910 and is currently estimated at $109,702, approximately $123 per square foot. 1611 Hillcrest St is a home located in Ingham County with nearby schools including Reo Elementary School, Attwood School, and Everett High School.
Ownership History
Date
Name
Owned For
Owner Type
Purchase Details
Closed on
Oct 12, 2021
Sold by
Smith Rachael
Bought by
Love Carthell Brenda and Thompson Michael
Current Estimated Value
Purchase Details
Closed on
Oct 4, 2021
Sold by
Palmer Anita
Bought by
Smith Rachael
Purchase Details
Closed on
Apr 27, 2006
Sold by
Sweet Terrence and Sweet Mary
Bought by
Deutsche Bank National Trust Co
Purchase Details
Closed on
Mar 5, 2004
Sold by
Sweet Mary and Sweet Terrance
Bought by
Sweet Terrence and Sweet Mary
Home Financials for this Owner
Home Financials are based on the most recent Mortgage that was taken out on this home.
Original Mortgage
$72,250
Interest Rate
8%
Mortgage Type
Stand Alone Refi Refinance Of Original Loan
Purchase Details
Closed on
Sep 20, 2000
Sold by
Shiffer Robert G and Shiffer Mary Ellen
Bought by
Sweet Mary
Home Financials for this Owner
Home Financials are based on the most recent Mortgage that was taken out on this home.
Original Mortgage
$56,260
Interest Rate
7.98%
Mortgage Type
Purchase Money Mortgage
Create a Home Valuation Report for This Property
The Home Valuation Report is an in-depth analysis detailing your home's value as well as a comparison with similar homes in the area
Home Values in the Area
Average Home Value in this Area
Purchase History
| Date | Buyer | Sale Price | Title Company |
|---|---|---|---|
| Love Carthell Brenda | -- | None Available | |
| Smith Rachael | $25,000 | None Available | |
| Deutsche Bank National Trust Co | $75,428 | None Available | |
| Sweet Terrence | -- | Title Direct | |
| Sweet Mary | $58,000 | -- |
Source: Public Records
Mortgage History
| Date | Status | Borrower | Loan Amount |
|---|---|---|---|
| Previous Owner | Sweet Terrence | $72,250 | |
| Previous Owner | Sweet Mary | $56,260 |
Source: Public Records
Tax History Compared to Growth
Tax History
| Year | Tax Paid | Tax Assessment Tax Assessment Total Assessment is a certain percentage of the fair market value that is determined by local assessors to be the total taxable value of land and additions on the property. | Land | Improvement |
|---|---|---|---|---|
| 2025 | $3,066 | $47,800 | $10,900 | $36,900 |
| 2024 | $25 | $40,800 | $10,900 | $29,900 |
| 2023 | $2,886 | $36,500 | $10,900 | $25,600 |
| 2022 | $2,634 | $33,000 | $9,400 | $23,600 |
| 2021 | $1,949 | $28,200 | $5,600 | $22,600 |
| 2020 | $1,935 | $26,300 | $5,600 | $20,700 |
| 2019 | $3,357 | $25,200 | $5,600 | $19,600 |
| 2018 | $1,773 | $22,800 | $5,600 | $17,200 |
| 2017 | $1,706 | $22,800 | $5,600 | $17,200 |
| 2016 | $2,326 | $22,400 | $5,600 | $16,800 |
| 2015 | $2,326 | $21,800 | $11,179 | $10,621 |
| 2014 | $2,326 | $22,300 | $16,395 | $5,905 |
Source: Public Records
Map
Nearby Homes
- VL Hillcrest St
- 1321 Pompton Cir
- 1500 Pierce Rd
- 1422 Pierce Rd
- 1429 Pierce Rd
- 1301 Warwick Dr
- 1113 Eaton Ct
- 2029 Hillcrest St
- 1420 Reo Rd
- 0 Eaton Ct
- 1415 Reo Rd
- 1729 Reo Rd
- 4221 S Martin Luther King Junior Blvd
- 4414 S Martin Luther King jr Blvd
- 4620 Christiansen Rd
- 4017 Richmond St
- 1324 N Briarfield Dr
- 4110 Richmond St
- 2311 Greenbelt Dr
- 4114 Burchfield Dr
- 1605 Hillcrest St
- 1617 Hillcrest St
- 1517 Hillcrest St
- 1619 Hillcrest St
- 1612 Hillcrest St
- 1618 Hillcrest St
- 1518 Hillcrest St
- 1527 Hillcrest St
- 1715 Hillcrest St
- 3912 Marland Dr
- 3920 Marland Dr
- 1700 Hillcrest St
- 4002 Marland Dr
- 1514 Hillcrest St
- 4010 Marland Dr
- 3900 Marland Dr
- 1702 Hillcrest St
- 1520 Mary Ave
- 1721 Hillcrest St