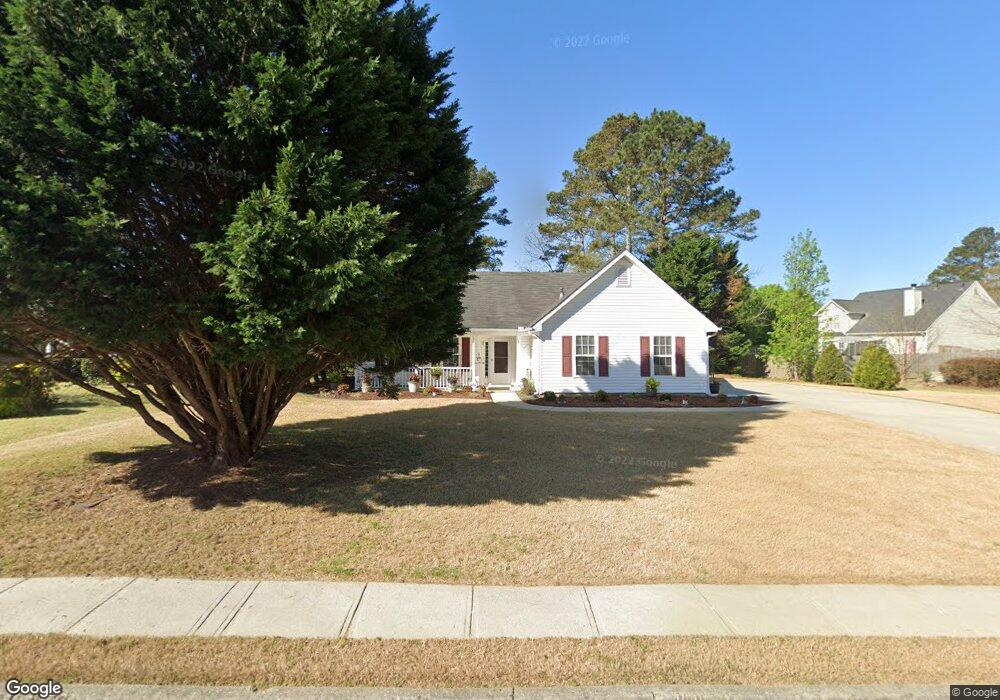
1611 Oak Trace Cir Unit 3 Grayson, GA 30017
Estimated Value: $315,000 - $373,000
3
Beds
2
Baths
1,645
Sq Ft
$211/Sq Ft
Est. Value
About This Home
This home is located at 1611 Oak Trace Cir Unit 3, Grayson, GA 30017 and is currently estimated at $347,278, approximately $211 per square foot. 1611 Oak Trace Cir Unit 3 is a home located in Gwinnett County with nearby schools including Starling Elementary School, Couch Middle School, and Grayson High School.
Ownership History
Date
Name
Owned For
Owner Type
Purchase Details
Closed on
Jun 15, 2020
Sold by
Philips Cathy Lynn
Bought by
Buschbom Andrew Oscar
Current Estimated Value
Home Financials for this Owner
Home Financials are based on the most recent Mortgage that was taken out on this home.
Original Mortgage
$140,000
Outstanding Balance
$123,550
Interest Rate
3.2%
Mortgage Type
New Conventional
Estimated Equity
$223,728
Purchase Details
Closed on
Mar 25, 2020
Sold by
Phillips Mary Anne Salemme
Bought by
Phillips Cathy Lynn and Phillips Michael Allen
Purchase Details
Closed on
Jun 19, 1998
Sold by
Beazer Homes Corp
Bought by
Phillips Mary A
Home Financials for this Owner
Home Financials are based on the most recent Mortgage that was taken out on this home.
Original Mortgage
$80,000
Interest Rate
7.21%
Mortgage Type
New Conventional
Create a Home Valuation Report for This Property
The Home Valuation Report is an in-depth analysis detailing your home's value as well as a comparison with similar homes in the area
Home Values in the Area
Average Home Value in this Area
Purchase History
| Date | Buyer | Sale Price | Title Company |
|---|---|---|---|
| Buschbom Andrew Oscar | $175,000 | -- | |
| Phillips Cathy Lynn | -- | -- | |
| Phillips Mary A | $131,900 | -- |
Source: Public Records
Mortgage History
| Date | Status | Borrower | Loan Amount |
|---|---|---|---|
| Open | Buschbom Andrew Oscar | $140,000 | |
| Previous Owner | Phillips Mary A | $80,000 |
Source: Public Records
Tax History
| Year | Tax Paid | Tax Assessment Tax Assessment Total Assessment is a certain percentage of the fair market value that is determined by local assessors to be the total taxable value of land and additions on the property. | Land | Improvement |
|---|---|---|---|---|
| 2025 | $1,274 | $137,000 | $26,120 | $110,880 |
| 2024 | $1,270 | $126,960 | $26,120 | $100,840 |
| 2023 | $1,270 | $137,400 | $28,000 | $109,400 |
| 2022 | $1,231 | $114,640 | $22,000 | $92,640 |
| 2021 | $2,907 | $70,000 | $17,600 | $52,400 |
| 2020 | $3,190 | $77,400 | $17,600 | $59,800 |
| 2019 | $806 | $70,720 | $15,600 | $55,120 |
| 2018 | $788 | $64,240 | $12,800 | $51,440 |
| 2016 | $829 | $59,000 | $12,800 | $46,200 |
| 2015 | $840 | $46,400 | $11,000 | $35,400 |
| 2014 | -- | $46,400 | $11,000 | $35,400 |
Source: Public Records
Map
Nearby Homes
- 495 Brackin Trace
- 1421 Sutters Dr
- 1180 Cades Walk
- 727 Aura Trail
- 1026 King Iron Dr
- 312 Gates Mill Dr
- 490 Brackin Trace
- 1570 Hill Crossing Ct
- 1575 Gin Blossom Cir
- 145 Millennial Ct
- 170 Clark Lake Ln
- 492 Glenns Farm Ln Unit 1
- 567 Barlow Place
- 1460 Marthas Ct
- 1670 Cooper Lakes Dr
- 1858 Mcconnell Rd
- 216 Brackin Trace
- 2091 Ecoland Dr
- 2101 Ecoland Dr
- 14 Green Love Ln
- 1621 Oak Trace Cir
- 468 Ash Trace Ln
- 448 Ash Trace Ln Unit 1
- 478 Ash Trace Ln
- 1631 Oak Trace Cir
- 1614 Oak Trace Cir
- 1624 Oak Trace Cir
- 1604 Oak Trace Cir Unit 78
- 1604 Oak Trace Cir
- 488 Ash Trace Ln
- 1670 Willow River Run Unit 3
- 1670 Willow River Run
- 1660 Willow River Run Unit 3
- 1634 Oak Trace Cir Unit 3
- 1641 Oak Trace Cir Unit 3
- 418 Ash Trace Ln
- 498 Ash Trace Ln Unit 1
- 0 Ash Trace Ln Unit 8827142
- 1644 Oak Trace Cir
- 451 Ash Trace Ln Unit 1
Your Personal Tour Guide
Ask me questions while you tour the home.