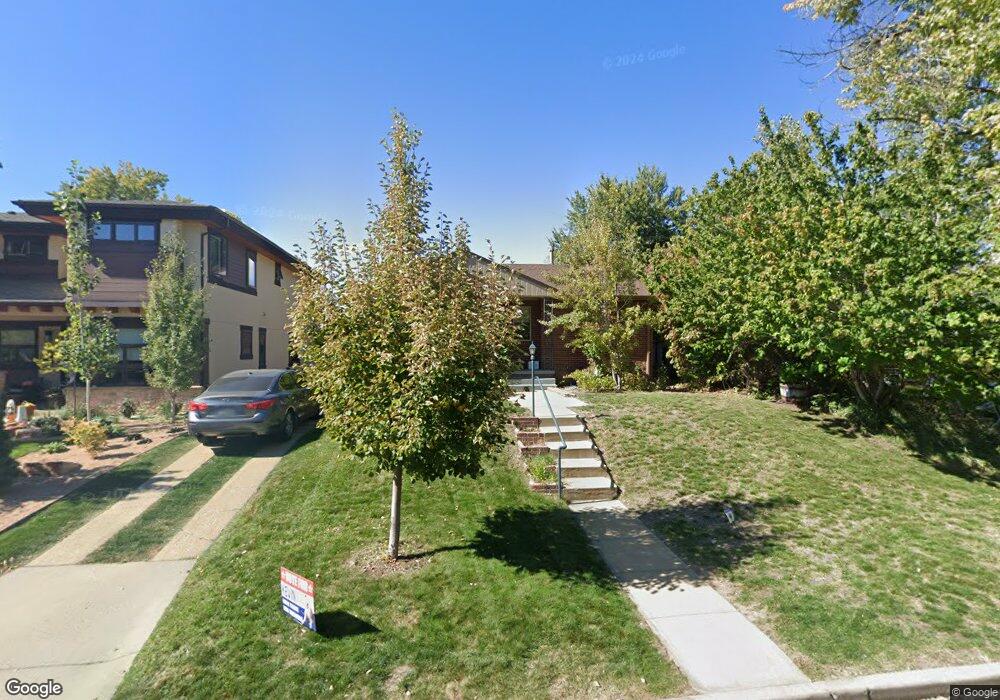
1611 S Josephine St Denver, CO 80210
Cory-Merrill NeighborhoodEstimated Value: $760,000 - $826,000
3
Beds
2
Baths
1,840
Sq Ft
$426/Sq Ft
Est. Value
About This Home
This home is located at 1611 S Josephine St, Denver, CO 80210 and is currently estimated at $783,833, approximately $425 per square foot. 1611 S Josephine St is a home located in Denver County with nearby schools including Cory Elementary School, Merrill Middle School, and South High School.
Ownership History
Date
Name
Owned For
Owner Type
Purchase Details
Closed on
Aug 27, 2025
Sold by
Taggart Kenneth and Taggart Kirsten
Bought by
Taggart Tyler and Lupo Justin
Current Estimated Value
Home Financials for this Owner
Home Financials are based on the most recent Mortgage that was taken out on this home.
Original Mortgage
$480,000
Outstanding Balance
$480,000
Interest Rate
5.63%
Mortgage Type
New Conventional
Estimated Equity
$303,833
Purchase Details
Closed on
May 11, 2017
Sold by
Cruse Thomas and Cruse Nicole
Bought by
Taggart Kenneth and Taggart Kirsten
Home Financials for this Owner
Home Financials are based on the most recent Mortgage that was taken out on this home.
Original Mortgage
$455,920
Interest Rate
4.14%
Mortgage Type
New Conventional
Purchase Details
Closed on
May 8, 2013
Sold by
Side Group Llc
Bought by
Cruse Thomas and Cruse Nicole
Home Financials for this Owner
Home Financials are based on the most recent Mortgage that was taken out on this home.
Original Mortgage
$360,000
Interest Rate
3.61%
Mortgage Type
New Conventional
Purchase Details
Closed on
Sep 27, 2012
Sold by
Penley Dennis R
Bought by
Side Group Llc
Purchase Details
Closed on
Sep 7, 2007
Sold by
Penley Owen L and Lucille Penley A
Bought by
Penley Owen L and Lucille Penley A
Purchase Details
Closed on
May 15, 2001
Sold by
Penley Owen L
Bought by
Penley Owen L and Lucille Penley A
Create a Home Valuation Report for This Property
The Home Valuation Report is an in-depth analysis detailing your home's value as well as a comparison with similar homes in the area
Home Values in the Area
Average Home Value in this Area
Purchase History
| Date | Buyer | Sale Price | Title Company |
|---|---|---|---|
| Taggart Tyler | $600,000 | Chicago Title | |
| Taggart Kenneth | $569,900 | Heritage Title Co | |
| Cruse Thomas | $450,000 | Fidelity National Title Insu | |
| Side Group Llc | $295,000 | None Available | |
| Penley Owen L | -- | None Available | |
| Penley Owen L | -- | -- |
Source: Public Records
Mortgage History
| Date | Status | Borrower | Loan Amount |
|---|---|---|---|
| Open | Taggart Tyler | $480,000 | |
| Previous Owner | Taggart Kenneth | $455,920 | |
| Previous Owner | Cruse Thomas | $360,000 |
Source: Public Records
Tax History Compared to Growth
Tax History
| Year | Tax Paid | Tax Assessment Tax Assessment Total Assessment is a certain percentage of the fair market value that is determined by local assessors to be the total taxable value of land and additions on the property. | Land | Improvement |
|---|---|---|---|---|
| 2024 | $4,187 | $52,870 | $33,980 | $18,890 |
| 2023 | $4,097 | $52,870 | $33,980 | $18,890 |
| 2022 | $3,486 | $43,830 | $32,560 | $11,270 |
| 2021 | $3,365 | $45,090 | $33,500 | $11,590 |
| 2020 | $3,191 | $43,010 | $31,270 | $11,740 |
| 2019 | $3,102 | $43,010 | $31,270 | $11,740 |
| 2018 | $2,899 | $37,470 | $28,110 | $9,360 |
| 2017 | $2,890 | $37,470 | $28,110 | $9,360 |
| 2016 | $2,952 | $36,200 | $26,101 | $10,099 |
| 2015 | $2,828 | $36,200 | $26,101 | $10,099 |
| 2014 | $2,481 | $29,870 | $18,642 | $11,228 |
Source: Public Records
Map
Nearby Homes
- 1601 S Columbine St
- 1520 S University Blvd
- 1518 S Columbine St
- 1624 S Elizabeth St
- 1476 S Josephine St
- 1544 S Elizabeth St
- 1491 S York St
- 1500 S Elizabeth St
- 1466 S Gaylord St
- 1625 S Fillmore St
- 1665 S Fillmore St
- 1410 S Elizabeth St
- 2225 Buchtel Blvd Unit 1011
- 2225 Buchtel Blvd Unit 703
- 2225 Buchtel Blvd Unit 1007
- 2225 Buchtel Blvd Unit 506
- 2225 Buchtel Blvd Unit 105
- 2225 Buchtel Blvd Unit 1005
- 2225 Buchtel Blvd Unit 207
- 1414 S Vine St
- 1601 S Josephine St
- 1621 S Josephine St
- 1625 S Josephine St
- 1610 S University Blvd
- 1635 S Josephine St
- 1600 S University Blvd
- 1620 S University Blvd
- 1595 S Josephine St
- 1630 S University Blvd
- 1612 S Josephine St
- 1602 S Josephine St
- 1622 S Josephine St
- 1645 S Josephine St
- 1585 S Josephine St
- 1640 S University Blvd
- 2351 E Iowa Ave
- 1642 S Josephine St
- 1590 S Josephine St
- 1655 S Josephine St
- 1573 S Josephine St