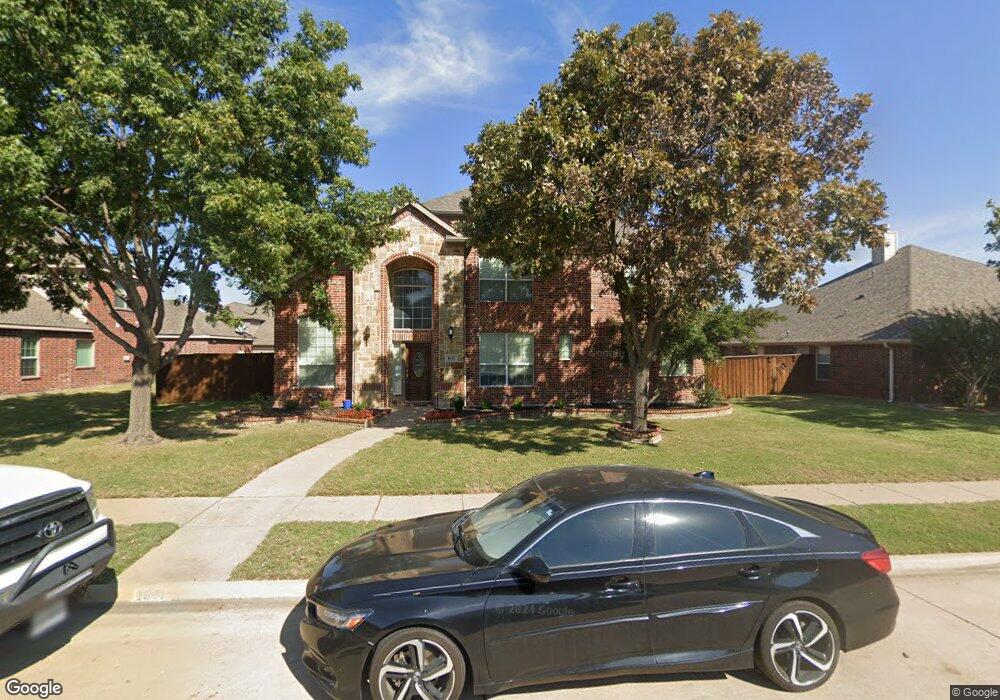
1611 Silverleaf Ln Allen, TX 75002
North East Allen NeighborhoodEstimated Value: $566,661 - $735,000
4
Beds
4
Baths
3,105
Sq Ft
$216/Sq Ft
Est. Value
About This Home
This home is located at 1611 Silverleaf Ln, Allen, TX 75002 and is currently estimated at $670,665, approximately $215 per square foot. 1611 Silverleaf Ln is a home located in Collin County with nearby schools including Robert L Puster Elementary School, Sloan Creek Intermediate School, and Willow Springs Middle School.
Ownership History
Date
Name
Owned For
Owner Type
Purchase Details
Closed on
Jul 20, 2012
Sold by
Burkhardt Cory and Burkhardt Whitney
Bought by
Eschler Robert K and Eschler Dina
Current Estimated Value
Home Financials for this Owner
Home Financials are based on the most recent Mortgage that was taken out on this home.
Original Mortgage
$232,000
Outstanding Balance
$160,222
Interest Rate
3.68%
Mortgage Type
New Conventional
Estimated Equity
$510,443
Purchase Details
Closed on
Nov 12, 2004
Sold by
Ashton Dallas Residential Llc
Bought by
Burkhardt Cory and Burkhardt Whitney
Home Financials for this Owner
Home Financials are based on the most recent Mortgage that was taken out on this home.
Original Mortgage
$188,118
Interest Rate
5.87%
Mortgage Type
Purchase Money Mortgage
Create a Home Valuation Report for This Property
The Home Valuation Report is an in-depth analysis detailing your home's value as well as a comparison with similar homes in the area
Home Values in the Area
Average Home Value in this Area
Purchase History
| Date | Buyer | Sale Price | Title Company |
|---|---|---|---|
| Eschler Robert K | -- | None Available | |
| Burkhardt Cory | -- | Stnt |
Source: Public Records
Mortgage History
| Date | Status | Borrower | Loan Amount |
|---|---|---|---|
| Open | Eschler Robert K | $232,000 | |
| Previous Owner | Burkhardt Cory | $188,118 | |
| Closed | Burkhardt Cory | $23,514 |
Source: Public Records
Tax History
| Year | Tax Paid | Tax Assessment Tax Assessment Total Assessment is a certain percentage of the fair market value that is determined by local assessors to be the total taxable value of land and additions on the property. | Land | Improvement |
|---|---|---|---|---|
| 2025 | $8,781 | $567,581 | $175,000 | $392,581 |
| 2024 | $8,812 | $542,913 | $175,000 | $422,037 |
| 2023 | $8,812 | $493,557 | $175,000 | $393,000 |
| 2022 | $9,555 | $448,688 | $150,000 | $380,929 |
| 2021 | $9,073 | $407,898 | $100,000 | $307,898 |
| 2020 | $8,665 | $374,557 | $100,000 | $274,557 |
| 2019 | $9,918 | $408,167 | $95,000 | $313,167 |
| 2018 | $9,434 | $384,750 | $85,000 | $299,750 |
| 2017 | $8,735 | $356,213 | $85,000 | $271,213 |
| 2016 | $8,529 | $343,950 | $85,000 | $258,950 |
| 2015 | $6,905 | $331,109 | $65,000 | $266,109 |
Source: Public Records
Map
Nearby Homes
- 1550 Charleston Dr
- 1578 Mahogany Dr
- 1513 Creek Springs Dr
- 1404 Settlers Ct
- 390 Oak Ridge Dr
- 620 Oakmont Ct
- 1306 Cedar Springs Dr
- 258 Britton Ct
- 211 Britton Ct
- 228 Britton Ct
- 1537 Silver Spur Dr
- 370 Oakwood Trail
- 1803 Caprock Rd
- 701 Meandering Way
- 1320 Red River Ln
- 1408 Creek Springs Dr
- 811 Shady Brook Ln
- 2017 Country Brook Ln
- 761 Creekwood Dr S
- 530 Lost Creek Trail
- 1609 Silverleaf Ln
- 1613 Silverleaf Ln
- 1610 Bryce Canyon Ln
- 1615 Silverleaf Ln
- 1607 Silverleaf Ln
- 1608 Bryce Canyon Ln
- 1612 Bryce Canyon Ln
- 1610 Silverleaf Ln
- 1612 Silverleaf Ln
- 1606 Bryce Canyon Ln
- 1614 Bryce Canyon Ln
- 1605 Silverleaf Ln
- 1617 Silverleaf Ln
- 1707 Ponderosa Dr
- 1614 Silverleaf Ln
- 1604 Bryce Canyon Ln
- 1616 Bryce Canyon Ln
- 1616 Silverleaf Ln
- 1705 Ponderosa Dr
- 1603 Silverleaf Ln
Your Personal Tour Guide
Ask me questions while you tour the home.