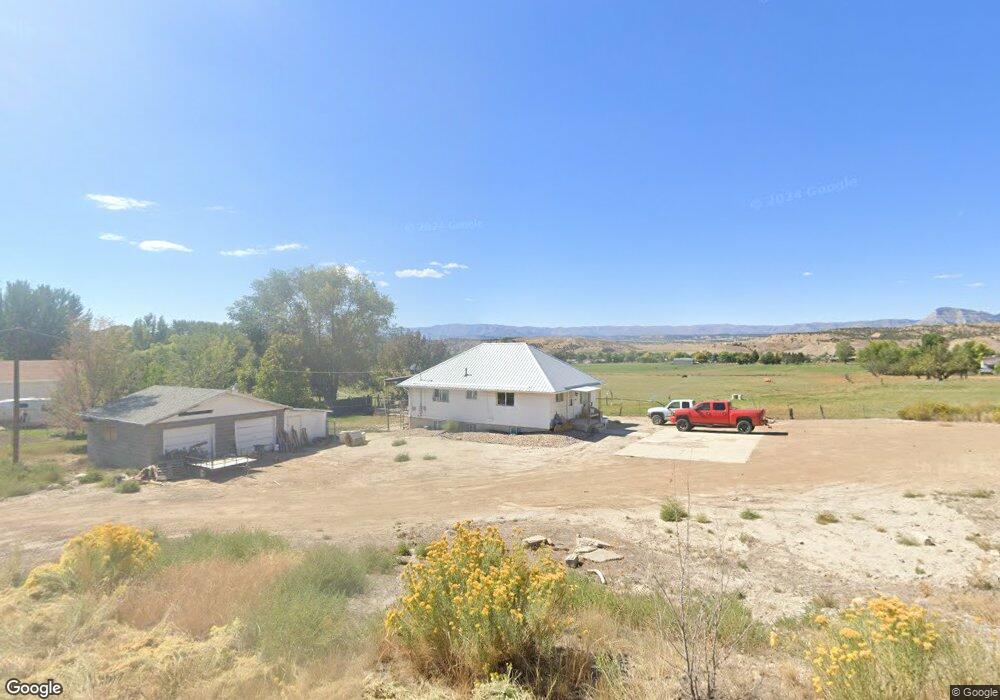
1611 W 4000 N Helper, UT 84526
Estimated Value: $247,000 - $342,000
4
Beds
2
Baths
1,886
Sq Ft
$155/Sq Ft
Est. Value
About This Home
This home is located at 1611 W 4000 N, Helper, UT 84526 and is currently estimated at $292,720, approximately $155 per square foot. 1611 W 4000 N is a home located in Carbon County with nearby schools including Sally Mauro School, Helper Middle School, and Carbon High School.
Ownership History
Date
Name
Owned For
Owner Type
Purchase Details
Closed on
May 28, 2025
Sold by
Nielson Jeff and Don And Peggy Nielson Trust
Bought by
Nielson Jeff and Nielson Heather
Current Estimated Value
Purchase Details
Closed on
Apr 1, 2025
Sold by
Nielson Jeff and Don And Peggy Nielson Trust
Bought by
Nielson Jeff and Nielson Heather
Purchase Details
Closed on
Feb 23, 2016
Sold by
Southeast Holdings Llc
Bought by
Nielson Jeff and Nielson Heather
Purchase Details
Closed on
Jul 15, 2015
Sold by
Secretary Of Hud
Bought by
Southeast Holdings Llc
Purchase Details
Closed on
Aug 21, 2014
Sold by
Singleton Cattle Company Lc
Bought by
Burk Ralph B
Purchase Details
Closed on
Jul 30, 2014
Sold by
Wells Fargo Bank Na
Bought by
Secretary Of Hud
Create a Home Valuation Report for This Property
The Home Valuation Report is an in-depth analysis detailing your home's value as well as a comparison with similar homes in the area
Home Values in the Area
Average Home Value in this Area
Purchase History
| Date | Buyer | Sale Price | Title Company |
|---|---|---|---|
| Nielson Jeff | -- | None Listed On Document | |
| Nielson Jeff | -- | None Listed On Document | |
| Nielson Jeff | -- | None Listed On Document | |
| Nielson Jeff | -- | None Listed On Document | |
| Nielson Jeff | -- | None Available | |
| Southeast Holdings Llc | -- | South Eastern Utah Title Co | |
| Burk Ralph B | -- | None Available | |
| Secretary Of Hud | -- | Professional Title Services |
Source: Public Records
Tax History Compared to Growth
Tax History
| Year | Tax Paid | Tax Assessment Tax Assessment Total Assessment is a certain percentage of the fair market value that is determined by local assessors to be the total taxable value of land and additions on the property. | Land | Improvement |
|---|---|---|---|---|
| 2025 | $1,765 | $136,670 | $32,849 | $103,821 |
| 2024 | $1,643 | $129,382 | $36,768 | $92,614 |
| 2023 | $1,486 | $126,392 | $27,500 | $98,892 |
| 2022 | $1,577 | $118,779 | $20,719 | $98,060 |
| 2021 | $1,458 | $174,162 | $30,380 | $143,782 |
| 2020 | $1,284 | $76,943 | $0 | $0 |
| 2019 | $943 | $69,098 | $0 | $0 |
| 2018 | $917 | $69,098 | $0 | $0 |
| 2017 | $617 | $47,197 | $0 | $0 |
| 2016 | $860 | $47,197 | $0 | $0 |
| 2015 | $860 | $73,463 | $0 | $0 |
| 2014 | $847 | $73,463 | $0 | $0 |
| 2013 | $854 | $73,463 | $0 | $0 |
Source: Public Records
Map
Nearby Homes
- 1630 W 4200 N Unit 5
- 1240 W 2360 N
- 1363 Shelby Ln
- 65 Locust St
- 2595 Fairway Ln Unit 11
- 2485 N 2650 W
- 1433 W 2060 N
- 2350 N 1075 W
- 261 Hill St
- 279 Hill St
- 5441 N Eagle Dr
- 286 Duchesne St
- 50 N Main St
- 653 Spring Canyon Rd
- 15 Fabrizio St
- 79 Garden St
- 180 Roosevelt St
- 73 Garden St
- 1643 N Mountain States Rd
- 47 B St
- 3910 N 1590 W
- 1588 W 4000 N
- 3843 N 1590 W
- 3888 N 1590 W
- 1553 W 4100 N
- 1553 W 4100 N Unit 2
- 1553 W 4100 N Unit 1
- 1553 W 4100 N Unit 3
- 3833 N 1590 W
- 3852 N 1590 W
- 1533 W 4000 N
- 1511 W 4000 N
- 1711 W 4100 N
- 1713 W 4100 N
- 3800 N 1590 W
- 1499 W 4000 N
- 4065 Blue Hill Dairy Rd
- 4065 Blue Hill Dairy Rd
- 4065 Blue Hill Dairy Rd
- 4065 Blue Hill Dairy Rd