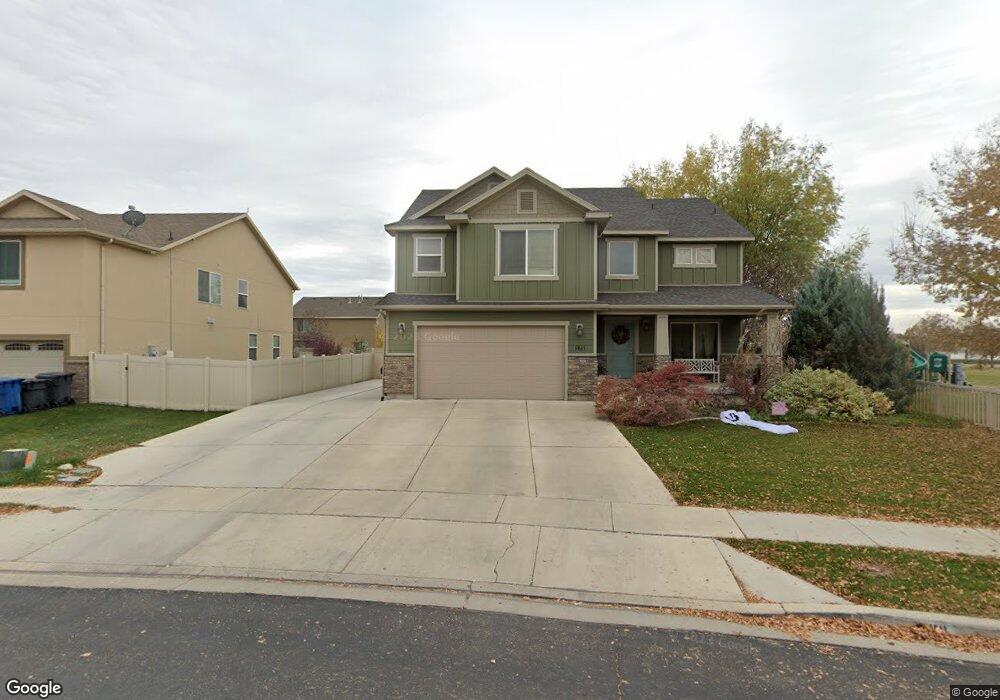
1611 W 540 N Lindon, UT 84042
Estimated Value: $610,000 - $810,000
3
Beds
3
Baths
2,388
Sq Ft
$281/Sq Ft
Est. Value
About This Home
This home is located at 1611 W 540 N, Lindon, UT 84042 and is currently estimated at $671,136, approximately $281 per square foot. 1611 W 540 N is a home located in Utah County with nearby schools including Lindon Elementary School, Oak Canyon Junior High School, and Pleasant Grove High School.
Ownership History
Date
Name
Owned For
Owner Type
Purchase Details
Closed on
Apr 18, 2017
Sold by
Johnson Arthur D and Johnson Janet W
Bought by
Johnson Arthur D and Johnson Janet
Current Estimated Value
Home Financials for this Owner
Home Financials are based on the most recent Mortgage that was taken out on this home.
Original Mortgage
$315,065
Outstanding Balance
$262,181
Interest Rate
4.21%
Mortgage Type
New Conventional
Estimated Equity
$408,955
Purchase Details
Closed on
Apr 10, 2017
Sold by
Johnson Brady
Bought by
Johnson Brady and Johnson Marion
Home Financials for this Owner
Home Financials are based on the most recent Mortgage that was taken out on this home.
Original Mortgage
$315,065
Outstanding Balance
$262,181
Interest Rate
4.21%
Mortgage Type
New Conventional
Estimated Equity
$408,955
Purchase Details
Closed on
Nov 1, 2010
Sold by
Fieldstone Utah Investors Llc
Bought by
Johnson Brady
Home Financials for this Owner
Home Financials are based on the most recent Mortgage that was taken out on this home.
Original Mortgage
$261,212
Interest Rate
4.33%
Mortgage Type
VA
Create a Home Valuation Report for This Property
The Home Valuation Report is an in-depth analysis detailing your home's value as well as a comparison with similar homes in the area
Home Values in the Area
Average Home Value in this Area
Purchase History
| Date | Buyer | Sale Price | Title Company |
|---|---|---|---|
| Johnson Arthur D | -- | None Available | |
| Johnson Brady | -- | Old Republic National Title | |
| Johnson Brady | -- | Bartlett Title Insurance Ag |
Source: Public Records
Mortgage History
| Date | Status | Borrower | Loan Amount |
|---|---|---|---|
| Open | Johnson Arthur D | $315,065 | |
| Closed | Johnson Brady | $261,212 |
Source: Public Records
Tax History Compared to Growth
Tax History
| Year | Tax Paid | Tax Assessment Tax Assessment Total Assessment is a certain percentage of the fair market value that is determined by local assessors to be the total taxable value of land and additions on the property. | Land | Improvement |
|---|---|---|---|---|
| 2025 | $2,331 | $309,485 | $240,700 | $322,000 |
| 2024 | $2,331 | $286,935 | $0 | $0 |
| 2023 | $2,217 | $293,095 | $0 | $0 |
| 2022 | $2,366 | $302,115 | $0 | $0 |
| 2021 | $2,042 | $393,200 | $151,100 | $242,100 |
| 2020 | $1,752 | $363,300 | $134,900 | $228,400 |
| 2019 | $1,752 | $346,400 | $120,700 | $225,700 |
| 2018 | $1,655 | $308,400 | $99,400 | $209,000 |
| 2017 | $1,628 | $162,635 | $0 | $0 |
| 2016 | $1,662 | $153,615 | $0 | $0 |
| 2015 | $1,736 | $151,690 | $0 | $0 |
| 2014 | $1,551 | $134,255 | $0 | $0 |
Source: Public Records
Map
Nearby Homes
- 556 N Buffalo Grass Ln
- 566 N Buffalo Grass Ln
- 554 N Buffalo Grass Ln
- 570 N Buffalo Grass Ln
- 564 N Buffalo Grass Ln
- 564 N Buffalo Grass Ln Unit 1250
- 558 N Buffalo Grass Ln
- 575 N Buffalo Grass Ln
- 574 N Cornstalk Ln
- 582 N Cornstalk Ln
- 568 N Buffalo Grass Ln
- 560 N Buffalo Grass Ln
- 605 N Buffalo Grass Ln
- 600 N Cornstalk Ln
- 572 N Buffalo Grass Ln
- 1362 W Valley Dr
- 611 N Briarwood Ln
- 1309 W Sweet Corn Ln
- Kirkwood Farmhouse Plan at Anderson Farms
- Clairemont Traditional Plan at Anderson Farms