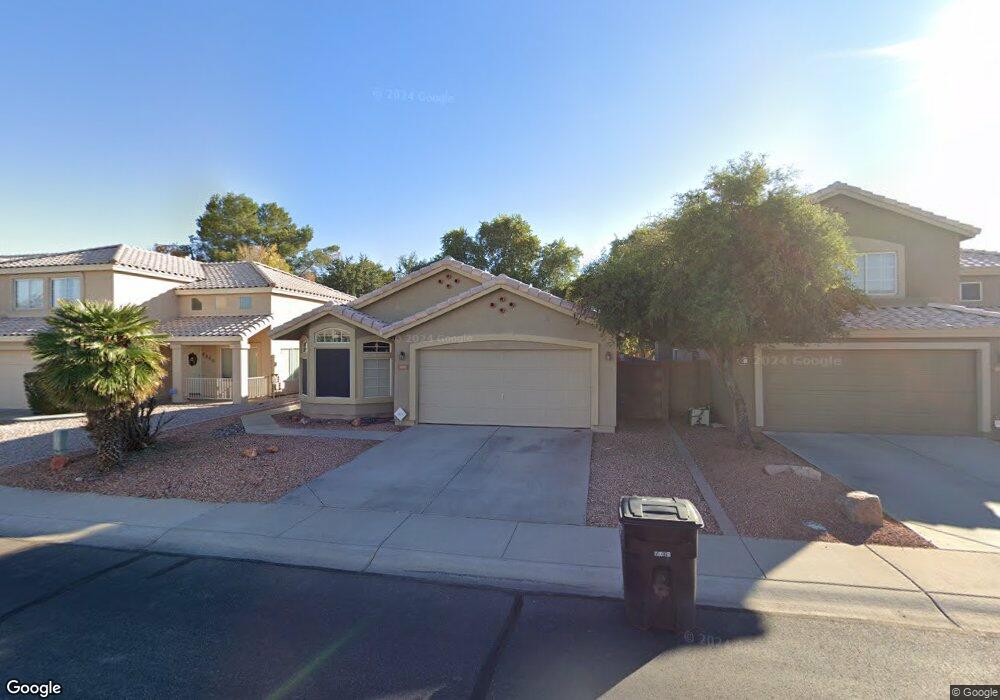
1611 W Orchid Ln Chandler, AZ 85224
Central Ridge NeighborhoodEstimated Value: $408,387 - $504,000
3
Beds
2
Baths
1,587
Sq Ft
$293/Sq Ft
Est. Value
About This Home
This home is located at 1611 W Orchid Ln, Chandler, AZ 85224 and is currently estimated at $465,347, approximately $293 per square foot. 1611 W Orchid Ln is a home located in Maricopa County with nearby schools including Andersen Elementary School, Andersen Junior High School, and Chandler High School.
Ownership History
Date
Name
Owned For
Owner Type
Purchase Details
Closed on
Feb 13, 2019
Sold by
Yellig William A
Bought by
Yellig William A and The William A Yellig Living Tr
Current Estimated Value
Purchase Details
Closed on
May 3, 2004
Sold by
Carre John A and Carre Patricia M
Bought by
Yellig William A
Home Financials for this Owner
Home Financials are based on the most recent Mortgage that was taken out on this home.
Original Mortgage
$129,600
Interest Rate
5.5%
Mortgage Type
New Conventional
Purchase Details
Closed on
Jul 21, 2001
Sold by
Carre John A and Carre Patricia M
Bought by
Carre John A and Carre Patricia M
Purchase Details
Closed on
Dec 20, 1995
Sold by
Drago John and Drago Jennifer
Bought by
Carre John A and Carre Patricia M
Home Financials for this Owner
Home Financials are based on the most recent Mortgage that was taken out on this home.
Original Mortgage
$88,000
Interest Rate
7.14%
Mortgage Type
New Conventional
Create a Home Valuation Report for This Property
The Home Valuation Report is an in-depth analysis detailing your home's value as well as a comparison with similar homes in the area
Home Values in the Area
Average Home Value in this Area
Purchase History
| Date | Buyer | Sale Price | Title Company |
|---|---|---|---|
| Yellig William A | -- | None Available | |
| Yellig William A | $162,000 | Security Title Agency | |
| Carre John A | -- | -- | |
| Carre John A | $110,000 | Security Title Agency |
Source: Public Records
Mortgage History
| Date | Status | Borrower | Loan Amount |
|---|---|---|---|
| Closed | Yellig William A | $129,600 | |
| Previous Owner | Carre John A | $88,000 |
Source: Public Records
Tax History Compared to Growth
Tax History
| Year | Tax Paid | Tax Assessment Tax Assessment Total Assessment is a certain percentage of the fair market value that is determined by local assessors to be the total taxable value of land and additions on the property. | Land | Improvement |
|---|---|---|---|---|
| 2025 | $1,939 | $20,733 | -- | -- |
| 2024 | $1,871 | $19,745 | -- | -- |
| 2023 | $1,871 | $34,610 | $6,920 | $27,690 |
| 2022 | $1,812 | $26,170 | $5,230 | $20,940 |
| 2021 | $1,862 | $24,510 | $4,900 | $19,610 |
| 2020 | $1,852 | $22,170 | $4,430 | $17,740 |
| 2019 | $1,787 | $20,710 | $4,140 | $16,570 |
| 2018 | $1,736 | $19,160 | $3,830 | $15,330 |
| 2017 | $1,631 | $18,380 | $3,670 | $14,710 |
| 2016 | $1,576 | $17,730 | $3,540 | $14,190 |
| 2015 | $1,511 | $16,700 | $3,340 | $13,360 |
Source: Public Records
Map
Nearby Homes
- 1640 W Gail Dr
- 1551 W Ironwood Dr
- 1825 W Ray Rd Unit 2036
- 1825 W Ray Rd Unit 1068
- 1825 W Ray Rd Unit 1008
- 1825 W Ray Rd Unit 1063
- 1825 W Ray Rd Unit 1054
- 1825 W Ray Rd Unit 2070
- 1825 W Ray Rd Unit 2044
- 1825 W Ray Rd Unit 1083
- 1825 W Ray Rd Unit 2082
- 1825 W Ray Rd Unit 2052
- 1592 W Shannon Ct
- 1293 W Orchid Ln
- 1050 N Verano Way
- 1323 W Manor St
- 1530 W Ivanhoe Ct
- 1260 N Salida Del Sol
- 1233 W Dublin St
- 1621 N Longmore St
- 1621 W Orchid Ln
- 1591 W Orchid Ln
- 1631 W Orchid Ln
- 1581 W Orchid Ln
- 1641 W Orchid Ln
- 1610 W Gail Dr
- 1610 W Orchid Ln
- 1600 W Gail Dr
- 1620 W Orchid Ln
- 1600 W Orchid Ln
- 1620 W Gail Dr
- 1630 W Orchid Ln
- 1590 W Orchid Ln
- 1651 W Orchid Ln
- 1630 W Gail Dr
- 1640 W Orchid Ln
- 1580 W Orchid Ln
- 1561 W Orchid Ln
- 1661 W Orchid Ln
- 1650 W Orchid Ln