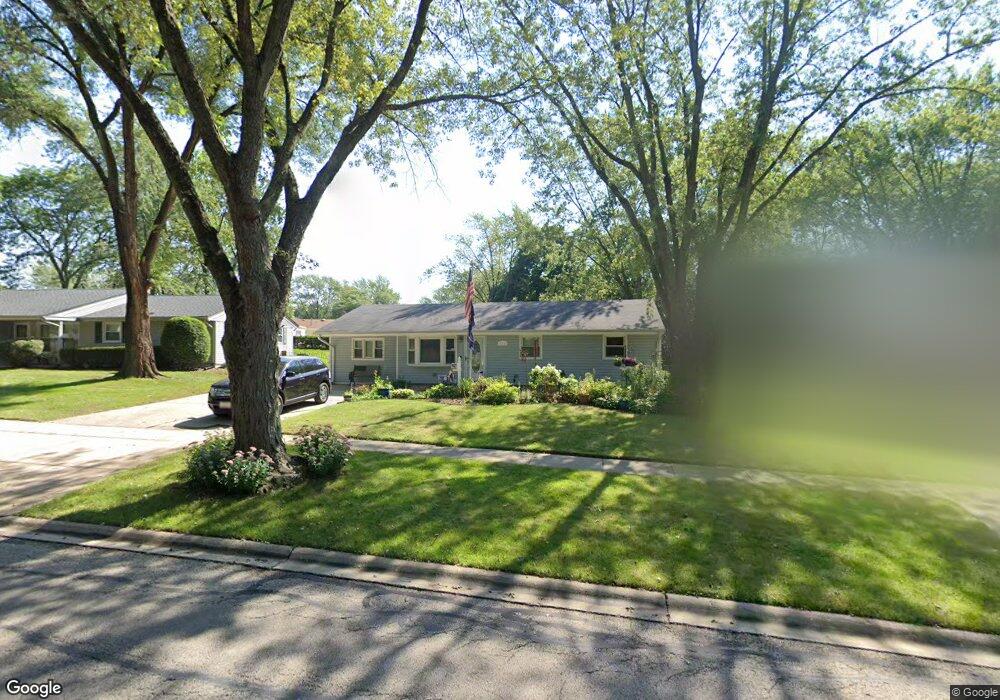
1611 Warwick Ln Schaumburg, IL 60193
West Schaumburg NeighborhoodEstimated Value: $361,000 - $372,000
3
Beds
1
Bath
1,250
Sq Ft
$293/Sq Ft
Est. Value
About This Home
This home is located at 1611 Warwick Ln, Schaumburg, IL 60193 and is currently estimated at $366,602, approximately $293 per square foot. 1611 Warwick Ln is a home located in Cook County with nearby schools including Campanelli Elementary School, Jane Addams Junior High School, and Schaumburg High School.
Ownership History
Date
Name
Owned For
Owner Type
Purchase Details
Closed on
Feb 6, 2002
Sold by
Dixon John T and Dixon Tiffany
Bought by
Green John M and Green Annette K
Current Estimated Value
Home Financials for this Owner
Home Financials are based on the most recent Mortgage that was taken out on this home.
Original Mortgage
$191,494
Outstanding Balance
$79,013
Interest Rate
7.03%
Mortgage Type
FHA
Estimated Equity
$287,589
Purchase Details
Closed on
Sep 25, 1998
Sold by
Colleran Susan M
Bought by
Dixon John T
Home Financials for this Owner
Home Financials are based on the most recent Mortgage that was taken out on this home.
Original Mortgage
$117,000
Interest Rate
6.9%
Purchase Details
Closed on
Dec 15, 1993
Sold by
Oster Anton Peter and Oster Betty W
Bought by
Colleran Susan M
Home Financials for this Owner
Home Financials are based on the most recent Mortgage that was taken out on this home.
Original Mortgage
$98,700
Interest Rate
4.5%
Create a Home Valuation Report for This Property
The Home Valuation Report is an in-depth analysis detailing your home's value as well as a comparison with similar homes in the area
Home Values in the Area
Average Home Value in this Area
Purchase History
| Date | Buyer | Sale Price | Title Company |
|---|---|---|---|
| Green John M | $194,500 | -- | |
| Dixon John T | $130,000 | -- | |
| Colleran Susan M | $82,333 | -- |
Source: Public Records
Mortgage History
| Date | Status | Borrower | Loan Amount |
|---|---|---|---|
| Open | Green John M | $191,494 | |
| Previous Owner | Dixon John T | $117,000 | |
| Previous Owner | Colleran Susan M | $98,700 |
Source: Public Records
Tax History Compared to Growth
Tax History
| Year | Tax Paid | Tax Assessment Tax Assessment Total Assessment is a certain percentage of the fair market value that is determined by local assessors to be the total taxable value of land and additions on the property. | Land | Improvement |
|---|---|---|---|---|
| 2024 | $6,354 | $26,000 | $6,567 | $19,433 |
| 2023 | $6,133 | $26,000 | $6,567 | $19,433 |
| 2022 | $6,133 | $26,000 | $6,567 | $19,433 |
| 2021 | $6,081 | $23,395 | $4,455 | $18,940 |
| 2020 | $6,045 | $23,395 | $4,455 | $18,940 |
| 2019 | $6,127 | $26,287 | $4,455 | $21,832 |
| 2018 | $5,023 | $20,171 | $3,986 | $16,185 |
| 2017 | $4,961 | $20,171 | $3,986 | $16,185 |
| 2016 | $4,882 | $20,171 | $3,986 | $16,185 |
| 2015 | $4,368 | $17,225 | $3,517 | $13,708 |
| 2014 | $4,337 | $17,225 | $3,517 | $13,708 |
| 2013 | $4,208 | $17,225 | $3,517 | $13,708 |
Source: Public Records
Map
Nearby Homes
- 231 Webster Ln
- 100 Waban Ct
- 1614 Kingston Ln
- 1336 Wakeby Ln Unit 444
- 1601 Kingston Ln
- 1939 Weston Ln
- 227 S Walnut Ln
- 1933 Whittier Ln
- 521 Auburn Ln
- 13 Eastham Ct Unit 842
- 108 Idlestone Ln
- 630 Clover Ln
- 702 Auburn Cir
- 1125 Charlene Ln
- 8181 Northway Dr
- 1908 Capri Ln
- 8177 Northway Dr
- 104 N Braintree Dr
- 1403 Hampton Ln
- 413 Linsey Ave
- 1615 Warwick Ln
- 1614 Winchester Ln
- 1619 Warwick Ln
- 1610 Winchester Ln
- 1618 Winchester Ln
- 1601 Warwick Ln
- 1612 Warwick Ln
- 1622 Winchester Ct
- 1600 Warwick Ln
- 1600 Winchester Ln
- 1620 Winchester Ct
- 133 Westover Ln
- 1624 Winchester Ct
- 134 S Springinsguth Rd
- 1615 Winchester Ln
- 130 S Springinsguth Rd Unit 2
- 1611 Winchester Ln
- 1601 Winchester Ln
- 1619 Winchester Ln