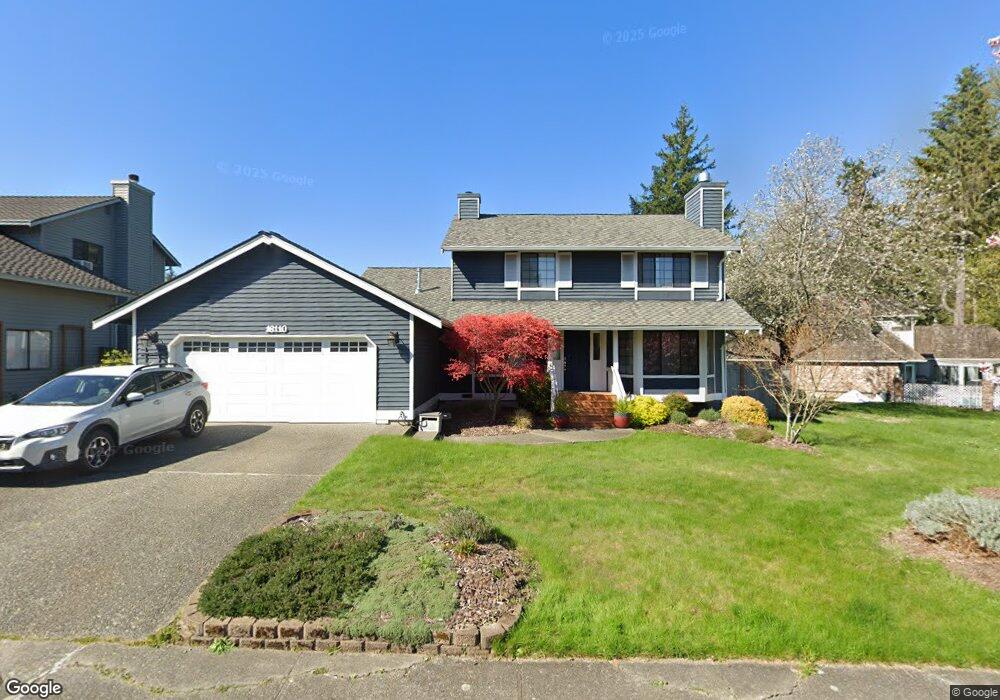
16110 SE 171st Place Renton, WA 98058
Estimated Value: $782,000 - $842,000
4
Beds
3
Baths
1,910
Sq Ft
$430/Sq Ft
Est. Value
About This Home
This home is located at 16110 SE 171st Place, Renton, WA 98058 and is currently estimated at $820,695, approximately $429 per square foot. 16110 SE 171st Place is a home located in King County with nearby schools including Fairwood Elementary School, Northwood Middle School, and Kentridge High School.
Ownership History
Date
Name
Owned For
Owner Type
Purchase Details
Closed on
Jun 27, 2003
Sold by
Dorney Kevin R and Dorney Linda M
Bought by
Sever Jorge N and Sever Sharon
Current Estimated Value
Home Financials for this Owner
Home Financials are based on the most recent Mortgage that was taken out on this home.
Original Mortgage
$219,920
Outstanding Balance
$93,499
Interest Rate
5.26%
Mortgage Type
Purchase Money Mortgage
Estimated Equity
$727,196
Purchase Details
Closed on
Oct 11, 2002
Sold by
Matthai Delores
Bought by
State Of Washington
Purchase Details
Closed on
Sep 23, 1996
Sold by
Cosby Kenneth R and Cosby Pamela Jo
Bought by
Dorney Kevin R and Dorney Linda M
Home Financials for this Owner
Home Financials are based on the most recent Mortgage that was taken out on this home.
Original Mortgage
$158,743
Interest Rate
7.87%
Mortgage Type
FHA
Purchase Details
Closed on
Sep 24, 1993
Sold by
Cosby Kenneth R and Cosby Pamela J
Bought by
Cosby Kenneth R and Pamela Jo
Create a Home Valuation Report for This Property
The Home Valuation Report is an in-depth analysis detailing your home's value as well as a comparison with similar homes in the area
Home Values in the Area
Average Home Value in this Area
Purchase History
| Date | Buyer | Sale Price | Title Company |
|---|---|---|---|
| Sever Jorge N | $274,900 | Fidelity Natio | |
| State Of Washington | $65,750 | Pacific Nw Tit | |
| Dorney Kevin R | $165,950 | First American Title Company | |
| Cosby Kenneth R | -- | -- |
Source: Public Records
Mortgage History
| Date | Status | Borrower | Loan Amount |
|---|---|---|---|
| Open | Sever Jorge N | $219,920 | |
| Previous Owner | Dorney Kevin R | $158,743 | |
| Closed | Sever Jorge N | $27,490 |
Source: Public Records
Tax History Compared to Growth
Tax History
| Year | Tax Paid | Tax Assessment Tax Assessment Total Assessment is a certain percentage of the fair market value that is determined by local assessors to be the total taxable value of land and additions on the property. | Land | Improvement |
|---|---|---|---|---|
| 2024 | $7,716 | $723,000 | $316,000 | $407,000 |
| 2023 | $7,379 | $630,000 | $275,000 | $355,000 |
| 2022 | $6,956 | $675,000 | $243,000 | $432,000 |
| 2021 | $6,319 | $550,000 | $213,000 | $337,000 |
| 2020 | $6,018 | $463,000 | $200,000 | $263,000 |
| 2018 | $5,616 | $445,000 | $148,000 | $297,000 |
| 2017 | $5,154 | $385,000 | $148,000 | $237,000 |
| 2016 | $5,075 | $346,000 | $120,000 | $226,000 |
| 2015 | $4,824 | $326,000 | $120,000 | $206,000 |
| 2014 | -- | $305,000 | $115,000 | $190,000 |
| 2013 | -- | $259,000 | $105,000 | $154,000 |
Source: Public Records
Map
Nearby Homes
- 17013 159th Place SE
- 16901 Woodside Dr SE
- 17504 160th Ave SE
- 17021 Parkside Way SE
- 16709 168th Terrace SE
- 16629 158th Place SE
- 17610 161st Ave SE
- 15638 SE 175th St
- 16632 157th Ct SE
- 15618 SE 174th St
- 17618 161st Ave SE
- 11517 155th Ave SE
- 15734 SE 166th Place
- 16522 Parkside Way SE
- 17716 157th Ave SE
- 16200 Parkside Way SE
- 17537 151st Ave SE Unit 9-4
- 17514 151st Ave SE Unit 1-16
- 17514 151st Ave SE Unit 14
- 16942 150th Ave SE
- 16104 SE 171st Place
- 161 SE 171st Place
- 16107 SE 170th Place
- 16113 SE 170th Place
- 16101 SE 170th Place
- 16122 SE 171st Place
- 17102 161st Ave SE
- 16115 SE 171st Place
- 16117 SE 170th Place
- 17105 163rd Place SE
- 17108 161st Ave SE
- 17104 163rd Place SE
- 17042 160th Place SE
- 17050 160th Place SE
- 16102 SE 170th Place
- 16114 SE 170th Place
- 17034 160th Place SE
- 16047 SE 171st Place
- 17113 163rd Place SE
- 17110 163rd Place SE