16111 Nc Hwy 73 E Unit D Mount Pleasant, NC 28124
Estimated Value: $230,000 - $421,000
3
Beds
2
Baths
2,045
Sq Ft
$148/Sq Ft
Est. Value
About This Home
This home is located at 16111 Nc Hwy 73 E Unit D, Mount Pleasant, NC 28124 and is currently estimated at $302,371, approximately $147 per square foot. 16111 Nc Hwy 73 E Unit D is a home located in Stanly County with nearby schools including Millingport Elementary School and North Stanly High School.
Ownership History
Date
Name
Owned For
Owner Type
Purchase Details
Closed on
Jan 1, 2012
Bought by
Mabry Roger L
Current Estimated Value
Purchase Details
Closed on
May 16, 2011
Sold by
Federal National Mortgage Association
Bought by
Mabry Roger Louis and Mabry Allison M
Purchase Details
Closed on
Sep 21, 2010
Sold by
Castellano Joanne
Bought by
Federal National Mortgage Association and Fannie Mae
Purchase Details
Closed on
Oct 26, 2007
Sold by
Safrit Thomas H and Safrit Hazel R
Bought by
Castellano Joanne
Home Financials for this Owner
Home Financials are based on the most recent Mortgage that was taken out on this home.
Original Mortgage
$142,500
Interest Rate
6.26%
Mortgage Type
New Conventional
Purchase Details
Closed on
May 25, 2006
Sold by
Curl Paticia S and Curl Kevin M
Bought by
Safrit Thomas H
Create a Home Valuation Report for This Property
The Home Valuation Report is an in-depth analysis detailing your home's value as well as a comparison with similar homes in the area
Home Values in the Area
Average Home Value in this Area
Purchase History
| Date | Buyer | Sale Price | Title Company |
|---|---|---|---|
| Mabry Roger L | -- | -- | |
| Mabry Roger Louis | -- | None Available | |
| Federal National Mortgage Association | $163,675 | None Available | |
| Castellano Joanne | $150,000 | None Available | |
| Safrit Thomas H | $56,000 | None Available |
Source: Public Records
Mortgage History
| Date | Status | Borrower | Loan Amount |
|---|---|---|---|
| Open | Mabry Roger L | $50,000 | |
| Previous Owner | Castellano Joanne | $142,500 |
Source: Public Records
Tax History Compared to Growth
Tax History
| Year | Tax Paid | Tax Assessment Tax Assessment Total Assessment is a certain percentage of the fair market value that is determined by local assessors to be the total taxable value of land and additions on the property. | Land | Improvement |
|---|---|---|---|---|
| 2024 | $1,165 | $164,064 | $61,253 | $102,811 |
| 2023 | $1,262 | $164,064 | $61,253 | $102,811 |
| 2022 | $1,262 | $164,064 | $61,253 | $102,811 |
| 2021 | $1,260 | $164,064 | $61,253 | $102,811 |
| 2020 | $1,178 | $142,812 | $55,557 | $87,255 |
| 2019 | $1,185 | $142,812 | $55,557 | $87,255 |
| 2018 | $1,100 | $142,812 | $55,557 | $87,255 |
| 2017 | $1,100 | $142,812 | $55,557 | $87,255 |
| 2016 | $985 | $136,820 | $49,360 | $87,460 |
| 2015 | $1,066 | $136,820 | $49,360 | $87,460 |
| 2014 | $935 | $136,820 | $49,360 | $87,460 |
Source: Public Records
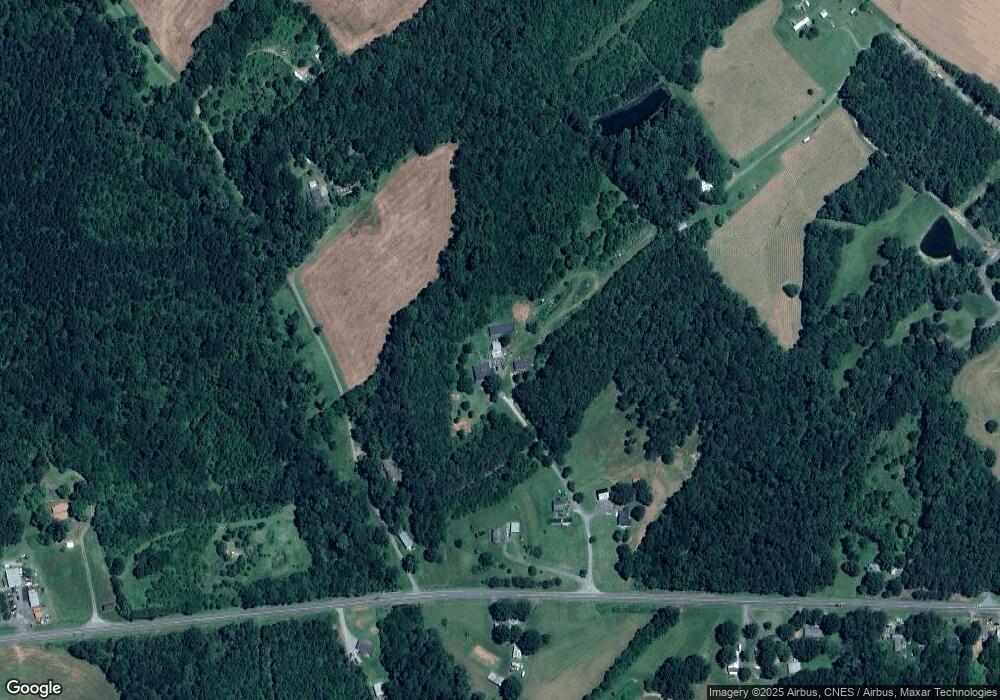
Map
Nearby Homes
- 16067 Nc Hwy 73 E
- 12020 Nc Hwy 73 Hwy
- 11769 Nc Hwy 73 E
- 1060 S Lentz Harness Shop Rd
- 3075 Lambert Rd
- 34568 Glory Hills Dr Unit Glory Hills Estates
- VAC Old Concord Rd
- 32905 Rowland Rd
- 20337 N Carolina 73
- 10200 Amsterdam Dr
- Lt 6 Flint Ridge Rd Unit 6
- 28518 Flint Ridge Rd
- Vacant Biles Rd Unit 4
- 10250 Barringer Ct
- 2260 Bilverlor Ct
- 8720 Lee St
- 1780 Short St
- 32562A Millingport Rd Unit 7155
- 32612B Millingport Rd Unit 7157
- 1920 Waldeck Ct
- 16111 Nc Hwy 73 E Unit B
- 16111 Nc Hwy 73 E Unit F
- 16111 Nc Hwy 73 E Unit A
- 16111 Nc Hwy 73 E Unit D
- 16111 Nc Hwy 73 E
- 16111 Nc Hwy 73 E Unit C
- 16111 Nc Hwy 73 E Unit D
- 16111 E Nc Hwy 73 Hwy
- 16160 Nc 73 Hwy E
- 16185 Nc 73 Hwy E
- 16170 Nc 73 Hwy E
- 16194 Nc Hwy 73 E
- 16092 Nc Hwy 73 E
- 34897 Banks Rd
- 16208 Nc Hwy 73 E
- 16067 Nc Hwy 73 E
- 16217 Nc Hwy 73 E
- 16067 Nc 73 Hwy E
- 32647 Bridge Rd
- 16052 Nc 73 Hwy E