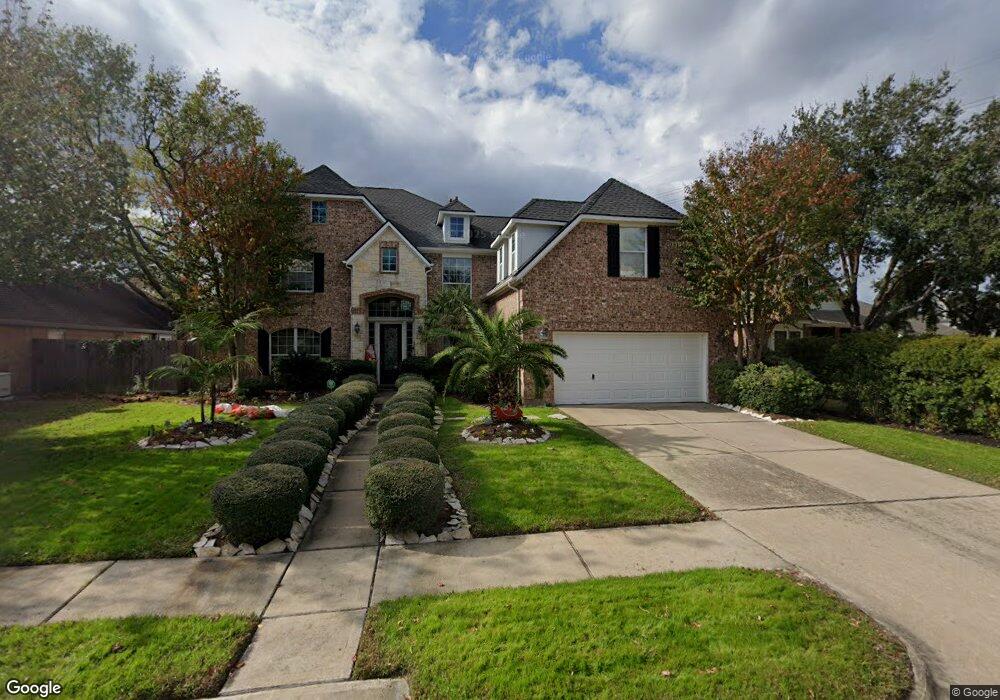
16111 Wild Grove Ct Tomball, TX 77377
Estimated Value: $474,519 - $513,000
4
Beds
4
Baths
3,838
Sq Ft
$130/Sq Ft
Est. Value
About This Home
This home is located at 16111 Wild Grove Ct, Tomball, TX 77377 and is currently estimated at $499,880, approximately $130 per square foot. 16111 Wild Grove Ct is a home located in Harris County with nearby schools including Lakewood Elementary School, Willow Wood Junior High School, and Northpointe Intermediate School.
Ownership History
Date
Name
Owned For
Owner Type
Purchase Details
Closed on
Nov 6, 2012
Sold by
Jourbert Gary Wayne
Bought by
Mui Dan Quy and Ha Dich Loan Ngoc
Current Estimated Value
Home Financials for this Owner
Home Financials are based on the most recent Mortgage that was taken out on this home.
Original Mortgage
$220,000
Outstanding Balance
$152,096
Interest Rate
3.4%
Mortgage Type
New Conventional
Estimated Equity
$347,784
Purchase Details
Closed on
Mar 29, 2005
Sold by
Gamble Tysha Michelle
Bought by
Joubert Gary Wayne
Purchase Details
Closed on
Dec 30, 2003
Sold by
Dreamtech Homes Ltd
Bought by
Joubert Gary and Joubert Tysha
Home Financials for this Owner
Home Financials are based on the most recent Mortgage that was taken out on this home.
Original Mortgage
$211,049
Interest Rate
7.16%
Mortgage Type
Purchase Money Mortgage
Create a Home Valuation Report for This Property
The Home Valuation Report is an in-depth analysis detailing your home's value as well as a comparison with similar homes in the area
Home Values in the Area
Average Home Value in this Area
Purchase History
| Date | Buyer | Sale Price | Title Company |
|---|---|---|---|
| Mui Dan Quy | -- | None Available | |
| Joubert Gary Wayne | -- | -- | |
| Joubert Gary | -- | Chicago Title |
Source: Public Records
Mortgage History
| Date | Status | Borrower | Loan Amount |
|---|---|---|---|
| Open | Mui Dan Quy | $220,000 | |
| Previous Owner | Joubert Gary | $211,049 | |
| Closed | Joubert Gary | $52,762 |
Source: Public Records
Tax History Compared to Growth
Tax History
| Year | Tax Paid | Tax Assessment Tax Assessment Total Assessment is a certain percentage of the fair market value that is determined by local assessors to be the total taxable value of land and additions on the property. | Land | Improvement |
|---|---|---|---|---|
| 2025 | $7,070 | $517,068 | $71,650 | $445,418 |
| 2024 | $7,070 | $489,351 | $68,755 | $420,596 |
| 2023 | $7,070 | $488,008 | $61,880 | $426,128 |
| 2022 | $9,176 | $444,843 | $61,880 | $382,963 |
| 2021 | $8,801 | $352,806 | $43,424 | $309,382 |
| 2020 | $8,598 | $332,063 | $43,424 | $288,639 |
| 2019 | $8,557 | $321,793 | $41,615 | $280,178 |
| 2018 | $3,383 | $293,482 | $44,422 | $249,060 |
| 2017 | $7,791 | $293,482 | $44,422 | $249,060 |
| 2016 | $7,791 | $293,482 | $44,422 | $249,060 |
| 2015 | $7,343 | $293,482 | $44,422 | $249,060 |
| 2014 | $7,343 | $270,531 | $44,422 | $226,109 |
Source: Public Records
Map
Nearby Homes
- 16102 Buckhead Ct
- 11719 Lakewood Crossing Dr
- 16206 Lakewood Field Dr
- 11722 Gray Forest Trail
- 11831 Gray Forest Trail
- 15915 Broad Oak Ct
- 11619 Buck Springs Trail
- 11607 Buck Springs Trail
- 15834 Arbor Lake Dr
- 11611 Teal Hollow Ln
- 11606 Gatesden Dr
- 11510 Maple Falls Dr
- 11802 Laurel Meadow Dr
- 15703 Downford Dr
- 11814 Lake Grove Ct
- 15603 Lakewood Terrace Dr
- 15726 Gettysburg Dr
- 11650 Brentcross Dr
- 15522 Waldwick Dr
- 15903 Heron Trail
- 16107 Wild Grove Ct
- 16115 Wild Grove Ct
- 16110 Buckhead Ct
- 16103 Wild Grove Ct
- 16114 Buckhead Ct
- 16106 Buckhead Ct
- 16110 Wild Grove Ct
- 16114 Wild Grove Ct
- 16106 Wild Grove Ct
- 16118 Wild Grove Ct
- 16102 Wild Grove Ct
- 16122 Wild Grove Ct
- 11319 Lakewood Field Ct
- 11323 Lakewood Field Ct
- 11723 Lakewood Crossing Dr
- 11315 Lakewood Field Ct
- 11727 Lakewood Crossing Dr
- 11327 Lakewood Field Ct
- 11311 Lakewood Field Ct
- 11327 Lakewood Field Ct