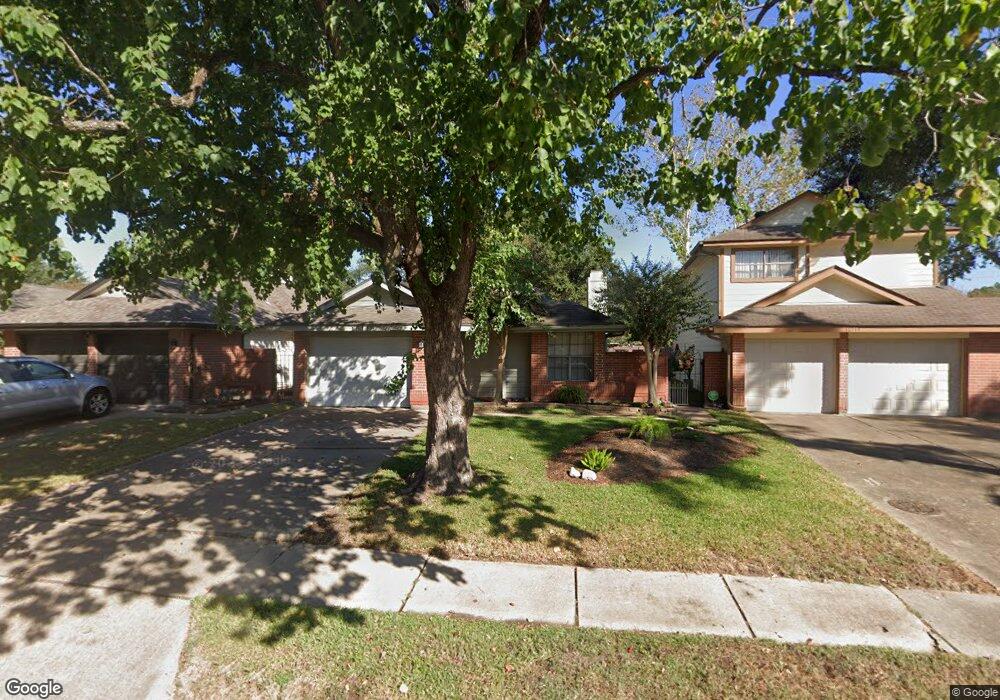
16118 Golden Sands Dr Houston, TX 77095
Copperfield NeighborhoodEstimated Value: $205,015 - $227,000
2
Beds
2
Baths
1,132
Sq Ft
$194/Sq Ft
Est. Value
About This Home
This home is located at 16118 Golden Sands Dr, Houston, TX 77095 and is currently estimated at $219,254, approximately $193 per square foot. 16118 Golden Sands Dr is a home located in Harris County with nearby schools including Fiest Elementary School, Labay Middle School, and Cypress Falls High School.
Ownership History
Date
Name
Owned For
Owner Type
Purchase Details
Closed on
Sep 28, 2011
Sold by
Oneal Erin C and Oneal Erin Calhoun
Bought by
Mallory Sharon Kaye
Current Estimated Value
Purchase Details
Closed on
Jan 24, 2011
Sold by
Bondurant Roberta and Bondurant Charles
Bought by
Oneal Erin Calhoun
Purchase Details
Closed on
May 11, 1998
Sold by
Rampelli Salvador J and Rodgers Kellie A
Bought by
Rankin Roberta D
Home Financials for this Owner
Home Financials are based on the most recent Mortgage that was taken out on this home.
Original Mortgage
$57,900
Interest Rate
7.18%
Purchase Details
Closed on
Feb 19, 1996
Sold by
Traylor Cynthia Ann and Shillman Cynthia Ann
Bought by
Rampelli Salvador J and Rodgers Kellie A
Home Financials for this Owner
Home Financials are based on the most recent Mortgage that was taken out on this home.
Original Mortgage
$56,610
Interest Rate
7.09%
Create a Home Valuation Report for This Property
The Home Valuation Report is an in-depth analysis detailing your home's value as well as a comparison with similar homes in the area
Home Values in the Area
Average Home Value in this Area
Purchase History
| Date | Buyer | Sale Price | Title Company |
|---|---|---|---|
| Mallory Sharon Kaye | -- | None Available | |
| Oneal Erin Calhoun | -- | First American Title | |
| Rankin Roberta D | -- | American Title Co | |
| Rampelli Salvador J | -- | Commonwealth Land Title Co |
Source: Public Records
Mortgage History
| Date | Status | Borrower | Loan Amount |
|---|---|---|---|
| Previous Owner | Rankin Roberta D | $57,900 | |
| Previous Owner | Rampelli Salvador J | $56,610 |
Source: Public Records
Tax History Compared to Growth
Tax History
| Year | Tax Paid | Tax Assessment Tax Assessment Total Assessment is a certain percentage of the fair market value that is determined by local assessors to be the total taxable value of land and additions on the property. | Land | Improvement |
|---|---|---|---|---|
| 2025 | $2,213 | $205,573 | $56,100 | $149,473 |
| 2024 | $2,213 | $199,277 | $46,860 | $152,417 |
| 2023 | $2,213 | $190,000 | $46,860 | $143,140 |
| 2022 | $3,560 | $175,326 | $33,440 | $141,886 |
| 2021 | $3,410 | $146,865 | $33,440 | $113,425 |
| 2020 | $3,260 | $136,707 | $27,940 | $108,767 |
| 2019 | $3,093 | $129,357 | $27,940 | $101,417 |
| 2018 | $952 | $113,912 | $27,940 | $85,972 |
| 2017 | $2,613 | $113,912 | $27,940 | $85,972 |
| 2016 | $2,613 | $113,912 | $27,940 | $85,972 |
| 2015 | $622 | $113,912 | $27,940 | $85,972 |
| 2014 | $622 | $97,174 | $21,560 | $75,614 |
Source: Public Records
Map
Nearby Homes
- 16111 Aberdeen Forest Dr
- 16123 Aberdeen Forest Dr
- 8814 Sherina Park Dr
- 8550 Sparkling Springs Dr
- 8818 Apple Mill Dr
- 16211 Green Smoke Dr
- 15954 Oak Mountain Dr
- 8550 Waiting Spring Ln
- 8426 Laurel Trails Dr
- 15906 Marwick Ct
- 8306 Lake Crystal Dr
- 8835 Aberdeen Park Dr
- 15735 Jamie Lee Dr
- 8526 Hot Springs Dr
- 8806 Gas Light Village Dr
- 16403 Torry View Terrace
- 15802 Aberdeen Trails Dr
- 8526 Greenleaf Lake Dr
- 8619 Arranmore Ln
- 16426 Torry View Terrace
- 16122 Golden Sands Dr
- 16114 Golden Sands Dr
- 16126 Golden Sands Dr
- 16130 Golden Sands Dr
- 16106 Golden Sands Dr
- 16123 Golden Sands Dr
- 16134 Golden Sands Dr
- 8639 Laurel Trails Dr
- 16127 Golden Sands Dr
- 16102 Golden Sands Dr
- 8635 Laurel Trails Dr
- 16138 Golden Sands Dr
- 16131 Golden Sands Dr
- 8631 Laurel Trails Dr
- 16135 Golden Sands Dr
- 8723 Aberdeen Palms Dr
- 8719 Aberdeen Palms Dr
- 16142 Golden Sands Dr
- 8627 Laurel Trails Dr
- 16139 Golden Sands Dr