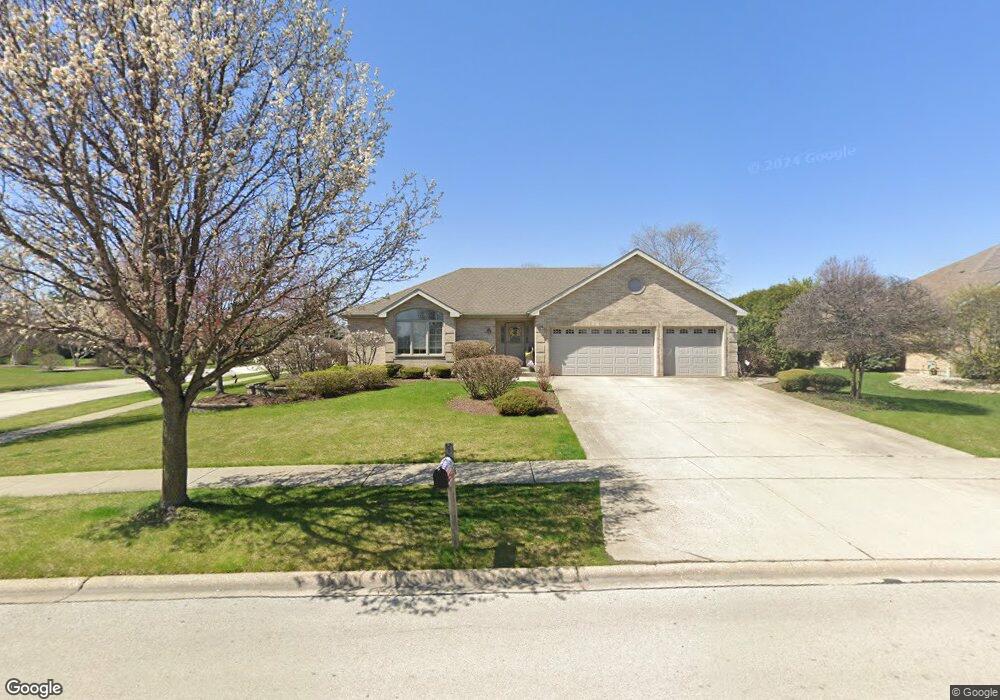
16118 W Red Cloud Dr Lockport, IL 60441
Estimated Value: $527,767 - $633,000
--
Bed
--
Bath
2,554
Sq Ft
$235/Sq Ft
Est. Value
About This Home
This home is located at 16118 W Red Cloud Dr, Lockport, IL 60441 and is currently estimated at $601,442, approximately $235 per square foot. 16118 W Red Cloud Dr is a home located in Will County with nearby schools including William J. Butler, Hadley Middle School, and Homer Jr High School.
Ownership History
Date
Name
Owned For
Owner Type
Purchase Details
Closed on
Nov 10, 2016
Sold by
Wasowicz Michael
Bought by
Wasowicz Phyllis
Current Estimated Value
Purchase Details
Closed on
Apr 24, 2015
Sold by
Wasowicz Brian G and Wasowicz Julie A
Bought by
Wasowicz Phyllis
Purchase Details
Closed on
Feb 1, 2013
Sold by
Wasowicz Brian G and Wasowicz Julie A
Bought by
Wasowicz Brian G and Wasowicz Julie A
Purchase Details
Closed on
Jun 2, 2005
Sold by
Kowalczyk Antoni and Kowalczyk Maria
Bought by
Wasowicz Michael and Wasowicz Brian
Purchase Details
Closed on
Sep 10, 2003
Sold by
Palos Bank & Trust Co
Bought by
Kowalzyk Antoni and Kowalzyk Maria
Create a Home Valuation Report for This Property
The Home Valuation Report is an in-depth analysis detailing your home's value as well as a comparison with similar homes in the area
Home Values in the Area
Average Home Value in this Area
Purchase History
| Date | Buyer | Sale Price | Title Company |
|---|---|---|---|
| Wasowicz Phyllis | -- | Attorney | |
| Wasowicz Phyllis | -- | None Available | |
| Wasowicz Brian G | -- | None Available | |
| Wasowicz Michael | $373,000 | Enterprise Land Title Ltd | |
| Kowalzyk Antoni | $135,000 | Chicago Title Insurance Co |
Source: Public Records
Tax History Compared to Growth
Tax History
| Year | Tax Paid | Tax Assessment Tax Assessment Total Assessment is a certain percentage of the fair market value that is determined by local assessors to be the total taxable value of land and additions on the property. | Land | Improvement |
|---|---|---|---|---|
| 2024 | $11,891 | $179,335 | $30,744 | $148,591 |
| 2023 | $11,891 | $162,559 | $27,868 | $134,691 |
| 2022 | $12,861 | $151,783 | $26,021 | $125,762 |
| 2021 | $12,634 | $143,802 | $24,653 | $119,149 |
| 2020 | $12,574 | $138,511 | $23,746 | $114,765 |
| 2019 | $12,088 | $133,248 | $22,844 | $110,404 |
| 2018 | $11,811 | $128,541 | $22,582 | $105,959 |
| 2017 | $11,618 | $124,943 | $21,950 | $102,993 |
| 2016 | $11,354 | $120,776 | $21,218 | $99,558 |
| 2015 | $11,658 | $116,243 | $20,422 | $95,821 |
| 2014 | $11,658 | $113,841 | $20,000 | $93,841 |
| 2013 | $11,658 | $117,750 | $23,909 | $93,841 |
Source: Public Records
Map
Nearby Homes
- 17040 Cheyenne Ct
- 17241 Arrow Head Dr
- 17326 Long Bow Dr
- 17234 Long Bow Dr
- 16125-45 Bruce Rd
- 17302 Long Bow Dr
- 16556 W Apache Dr
- 17526 S Gilbert Dr Unit 302D
- 17437 Yakima Dr
- 17542 Gilbert Dr Unit 404D
- 17612 S Gilbert Dr
- 17211 S Huron Ct
- 16727 S Sunset Ridge Ct
- 16335 Cagwin Dr Unit 2
- 16623 W Natoma Dr Unit 16623
- 16762 Swift Arrow Dr
- 17825 S Alta Dr
- 16146 W Oak Ave
- 16601 W Springview Dr
- 15959 Prairie View Ct Unit T6
- 16112 W Red Cloud Dr
- 17235 S Comanche Ct
- 16128 W Red Cloud Dr
- 16106 W Red Cloud Dr
- 16117 W Red Cloud Dr
- 17238 S Comanche Ct
- 17206 S Osage Ct
- 16138 W Red Cloud Dr
- 17225 S Comanche Ct
- 16111 W Red Cloud Dr
- 16123 W Red Cloud Dr
- 17218 S Comanche Ct
- 17228 S Comanche Ct
- 16105 W Red Cloud Dr
- 17162 S Osage Ct
- 16129 W Red Cloud Dr
- 16148 W Red Cloud Dr
- 16064 W Red Cloud Dr
- 16065 W Red Cloud Dr
- 16135 W Red Cloud Dr