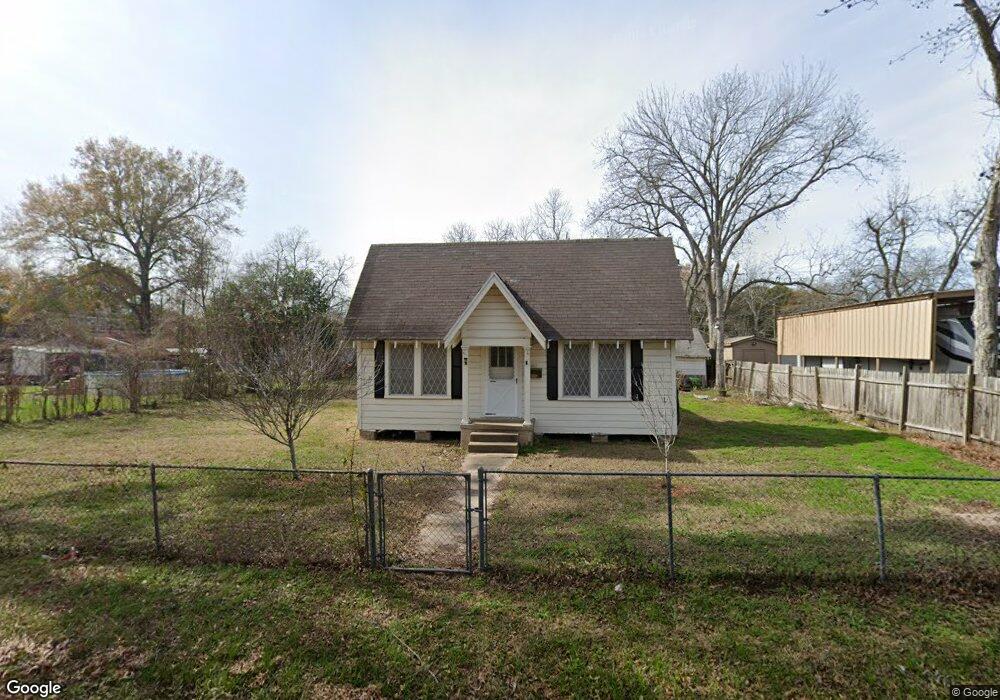
1612 7th St Rosenberg, TX 77471
Estimated Value: $208,477 - $217,000
2
Beds
1
Bath
1,142
Sq Ft
$186/Sq Ft
Est. Value
About This Home
This home is located at 1612 7th St, Rosenberg, TX 77471 and is currently estimated at $212,492, approximately $186 per square foot. 1612 7th St is a home located in Fort Bend County with nearby schools including Taylor Ray Elementary School, Navarro Middle School, and George Junior High School.
Ownership History
Date
Name
Owned For
Owner Type
Purchase Details
Closed on
Oct 12, 2009
Sold by
Garcia Daniel and Herrera Yrenia T
Bought by
Lozano Oscar
Current Estimated Value
Home Financials for this Owner
Home Financials are based on the most recent Mortgage that was taken out on this home.
Original Mortgage
$47,000
Interest Rate
5.1%
Mortgage Type
Purchase Money Mortgage
Create a Home Valuation Report for This Property
The Home Valuation Report is an in-depth analysis detailing your home's value as well as a comparison with similar homes in the area
Home Values in the Area
Average Home Value in this Area
Purchase History
| Date | Buyer | Sale Price | Title Company |
|---|---|---|---|
| Lozano Oscar | -- | Stewart Title Richmond | |
| Herrera Yrenia T | -- | Stewart Title Richmond |
Source: Public Records
Mortgage History
| Date | Status | Borrower | Loan Amount |
|---|---|---|---|
| Closed | Lozano Oscar | $47,000 |
Source: Public Records
Tax History Compared to Growth
Tax History
| Year | Tax Paid | Tax Assessment Tax Assessment Total Assessment is a certain percentage of the fair market value that is determined by local assessors to be the total taxable value of land and additions on the property. | Land | Improvement |
|---|---|---|---|---|
| 2025 | $4,163 | $189,596 | $107,702 | $81,894 |
| 2024 | $4,163 | $220,407 | $107,702 | $112,705 |
| 2023 | $3,771 | $195,342 | $84,476 | $110,866 |
| 2022 | $3,502 | $170,990 | $84,480 | $86,510 |
| 2021 | $2,650 | $127,740 | $75,630 | $52,110 |
| 2020 | $2,637 | $124,240 | $74,720 | $49,520 |
| 2019 | $2,171 | $95,040 | $43,620 | $51,420 |
| 2018 | $2,061 | $88,800 | $43,620 | $45,180 |
| 2017 | $1,794 | $76,880 | $43,620 | $33,260 |
| 2016 | $1,553 | $66,520 | $43,620 | $22,900 |
| 2015 | $1,563 | $66,630 | $43,620 | $23,010 |
| 2014 | $1,569 | $66,070 | $43,620 | $22,450 |
Source: Public Records
Map
Nearby Homes