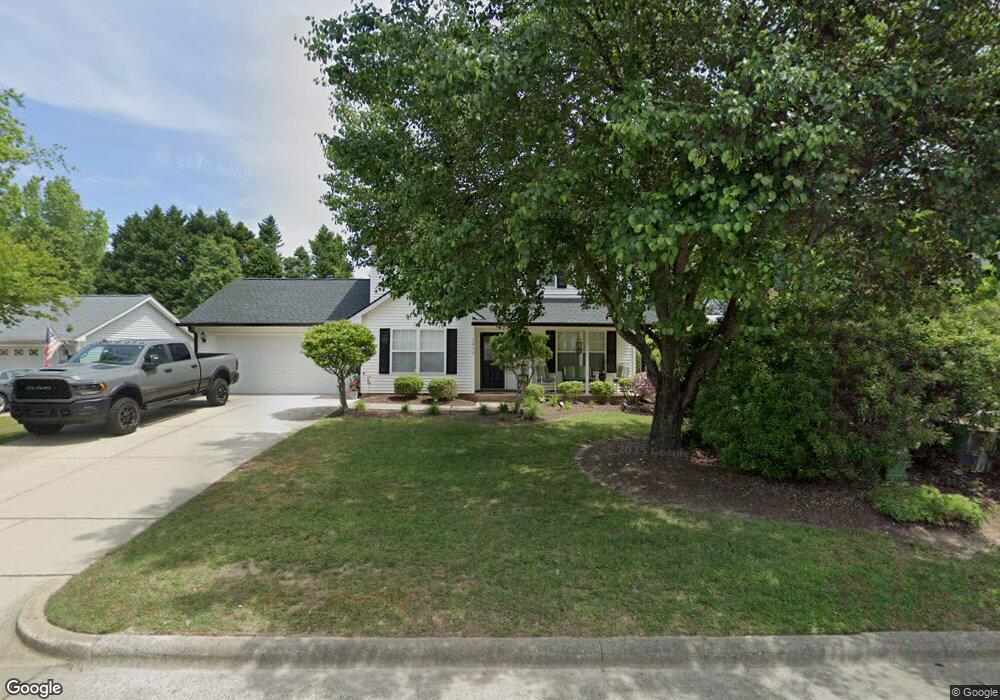
1612 Balfour Downs Cir Fuquay Varina, NC 27526
Estimated Value: $327,000 - $355,181
3
Beds
3
Baths
1,536
Sq Ft
$222/Sq Ft
Est. Value
About This Home
This home is located at 1612 Balfour Downs Cir, Fuquay Varina, NC 27526 and is currently estimated at $340,545, approximately $221 per square foot. 1612 Balfour Downs Cir is a home located in Wake County with nearby schools including Holly Grove Middle School and Fuquay-Varina High.
Ownership History
Date
Name
Owned For
Owner Type
Purchase Details
Closed on
Jul 25, 2012
Sold by
Secretary Of Housing & Urban Development
Bought by
Hankins Carla R
Current Estimated Value
Home Financials for this Owner
Home Financials are based on the most recent Mortgage that was taken out on this home.
Original Mortgage
$105,725
Outstanding Balance
$73,153
Interest Rate
3.72%
Mortgage Type
New Conventional
Estimated Equity
$267,392
Purchase Details
Closed on
Jan 18, 2012
Sold by
Wisdom Patrick R and Wisdom Melissa M
Bought by
The Secretary Of Housing & Urban Develop
Purchase Details
Closed on
Oct 22, 2003
Sold by
Werner Michael T and Werner Pamela
Bought by
Wisdom Patrick R and Wisdom Melissa M
Home Financials for this Owner
Home Financials are based on the most recent Mortgage that was taken out on this home.
Original Mortgage
$112,113
Interest Rate
6.03%
Mortgage Type
FHA
Purchase Details
Closed on
Dec 30, 1997
Sold by
Werner Michael T
Bought by
Werner Michael T
Create a Home Valuation Report for This Property
The Home Valuation Report is an in-depth analysis detailing your home's value as well as a comparison with similar homes in the area
Home Values in the Area
Average Home Value in this Area
Purchase History
| Date | Buyer | Sale Price | Title Company |
|---|---|---|---|
| Hankins Carla R | -- | None Available | |
| The Secretary Of Housing & Urban Develop | $96,000 | None Available | |
| Wisdom Patrick R | $113,000 | -- | |
| Werner Michael T | -- | -- |
Source: Public Records
Mortgage History
| Date | Status | Borrower | Loan Amount |
|---|---|---|---|
| Open | Hankins Carla R | $105,725 | |
| Previous Owner | Wisdom Patrick R | $112,113 |
Source: Public Records
Tax History Compared to Growth
Tax History
| Year | Tax Paid | Tax Assessment Tax Assessment Total Assessment is a certain percentage of the fair market value that is determined by local assessors to be the total taxable value of land and additions on the property. | Land | Improvement |
|---|---|---|---|---|
| 2025 | $2,958 | $335,692 | $95,000 | $240,692 |
| 2024 | $2,946 | $335,692 | $95,000 | $240,692 |
| 2023 | $2,488 | $221,969 | $43,000 | $178,969 |
| 2022 | $2,338 | $221,969 | $43,000 | $178,969 |
| 2021 | $2,229 | $221,969 | $43,000 | $178,969 |
| 2020 | $2,229 | $221,969 | $43,000 | $178,969 |
| 2019 | $1,817 | $155,789 | $37,000 | $118,789 |
| 2018 | $1,713 | $155,789 | $37,000 | $118,789 |
| 2017 | $1,652 | $155,789 | $37,000 | $118,789 |
| 2016 | $1,629 | $155,789 | $37,000 | $118,789 |
| 2015 | $1,499 | $147,969 | $35,000 | $112,969 |
| 2014 | $1,445 | $147,969 | $35,000 | $112,969 |
Source: Public Records
Map
Nearby Homes
- 1728 Balfour Downs Cir
- 1726 Stroll Cir
- 1707 Stroll Cir
- 1919 Stroll Cir
- 316 Edgecroft Way
- 328 Edgecroft Way
- 176 Breezemont Dr
- 1894 Landstrom Ln
- 1020 Garrow Dr
- 552 Stobhill Ln
- 151 Stobhill Ln
- 1210 Briar Gate Dr
- 219 Dickens Rd
- 2113 Feather Ridge Dr
- 281 Rhoda Lilley Dr
- 1325 Eagle Eye Ct
- 1017 Quindell Dr
- 412 Stobhill Ln
- 38 Clove Hitch Ln
- 305 Dickens Rd
- 1608 Balfour Downs Cir
- 1616 Balfour Downs Cir
- 1620 Balfour Downs Cir
- 1604 Balfour Downs Cir
- 1613 Balfour Downs Cir
- 1617 Balfour Downs Cir
- 1600 Balfour Downs Cir
- 1624 Balfour Downs Cir
- 1813 Balfour Downs Cir
- 1621 Balfour Downs Cir
- 1809 Balfour Downs Cir
- 1805 Balfour Downs Cir
- 1528 Balfour Downs Cir
- 1625 Balfour Downs Cir
- 1801 Balfour Downs Cir
- 1628 Balfour Downs Cir
- 1725 Balfour Downs Cir
- 1524 Balfour Downs Cir
- 1705 Balfour Downs Cir
- 1723 Balfour Downs Cir