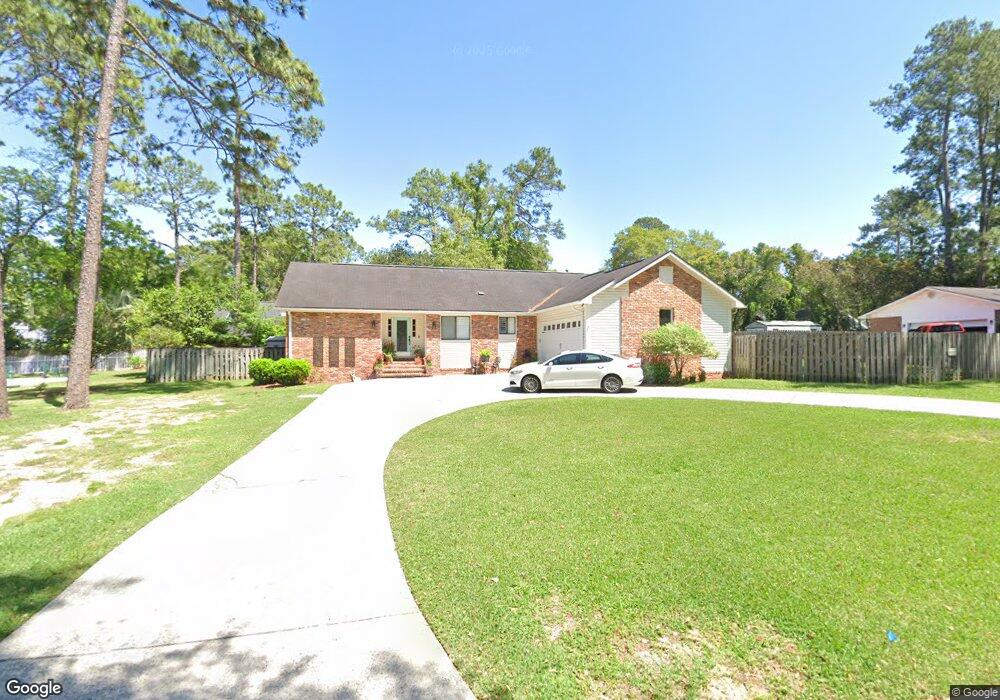
1612 Booth St Waycross, GA 31501
Estimated Value: $253,000 - $277,000
3
Beds
2
Baths
1,912
Sq Ft
$136/Sq Ft
Est. Value
About This Home
This home is located at 1612 Booth St, Waycross, GA 31501 and is currently estimated at $260,336, approximately $136 per square foot. 1612 Booth St is a home located in Ware County with nearby schools including Center Elementary School, Waycross Middle School, and Ware County High School.
Ownership History
Date
Name
Owned For
Owner Type
Purchase Details
Closed on
Dec 15, 2020
Sold by
Frye Wilbur Eugene
Bought by
Worley Robert A and Worley Diana T
Current Estimated Value
Home Financials for this Owner
Home Financials are based on the most recent Mortgage that was taken out on this home.
Original Mortgage
$148,000
Outstanding Balance
$131,764
Interest Rate
2.7%
Mortgage Type
New Conventional
Estimated Equity
$128,572
Purchase Details
Closed on
Jun 16, 2017
Sold by
Gattis Robert C
Bought by
Frye Wilbur Eugene
Home Financials for this Owner
Home Financials are based on the most recent Mortgage that was taken out on this home.
Original Mortgage
$165,938
Interest Rate
3.87%
Mortgage Type
FHA
Purchase Details
Closed on
Sep 28, 1993
Bought by
Gattis Robert C and Gattis Fr
Purchase Details
Closed on
Mar 9, 1992
Bought by
Konnerth Kyle and Konnerth Kath
Create a Home Valuation Report for This Property
The Home Valuation Report is an in-depth analysis detailing your home's value as well as a comparison with similar homes in the area
Home Values in the Area
Average Home Value in this Area
Purchase History
| Date | Buyer | Sale Price | Title Company |
|---|---|---|---|
| Worley Robert A | $185,000 | -- | |
| Frye Wilbur Eugene | $169,000 | -- | |
| Gattis Robert C | $77,500 | -- | |
| Konnerth Kyle | $68,500 | -- |
Source: Public Records
Mortgage History
| Date | Status | Borrower | Loan Amount |
|---|---|---|---|
| Open | Worley Robert A | $148,000 | |
| Previous Owner | Frye Wilbur Eugene | $165,938 |
Source: Public Records
Tax History Compared to Growth
Tax History
| Year | Tax Paid | Tax Assessment Tax Assessment Total Assessment is a certain percentage of the fair market value that is determined by local assessors to be the total taxable value of land and additions on the property. | Land | Improvement |
|---|---|---|---|---|
| 2024 | $2,030 | $91,822 | $4,320 | $87,502 |
| 2023 | $2,072 | $73,923 | $4,654 | $69,269 |
| 2022 | $2,473 | $73,923 | $4,654 | $69,269 |
| 2021 | $2,614 | $61,909 | $4,654 | $57,255 |
| 2020 | $2,698 | $61,909 | $4,654 | $57,255 |
| 2019 | $2,583 | $58,438 | $4,654 | $53,784 |
| 2018 | $2,531 | $56,702 | $4,654 | $52,048 |
| 2017 | $2,372 | $56,702 | $4,654 | $52,048 |
| 2016 | $2,372 | $56,702 | $4,654 | $52,048 |
| 2015 | $2,388 | $56,701 | $4,654 | $52,048 |
| 2014 | $2,386 | $56,702 | $4,654 | $52,048 |
| 2013 | -- | $56,701 | $4,653 | $52,048 |
Source: Public Records
Map
Nearby Homes
- 1617 Moss Creek Rd
- 1622 Booth St
- 1504 Danora Dr
- 1502 Seminole Trail
- 1621 Camellia Dr
- 1703 Rainbow Dr
- 1400 E Cherokee Dr
- 1206 Morningside Dr
- 00 Seminole Trail
- Lot 3 City Blvd
- 914 Barkley St
- 1715 City Blvd
- 1103 Kontz Ave
- 1312 Atlantic Ave
- 1011 Cherokee Cir
- 1204 Richmond Ave
- 1100 Euclid Ave
- 1002 Baltimore Ave
- 955 Lynn Dr
- 1002 Cherokee Cir
- 0 Booth St Unit 7521587
- 0 Booth St Unit 29932
- 0 Booth St
- 1614 Booth St
- 1610 Booth St
- 1615 Seminole Springs Rd
- 1613 Booth St
- 1611 Booth St
- 1615 Booth St
- 1617 Seminole Springs Rd
- 1611 Seminole Springs Rd
- 1616 Booth St
- 1608 Booth St
- 1609 Booth St
- 1614 Moss Creek Rd
- 1619 Seminole Springs Rd
- 1612 Moss Creek Rd
- 1609 Seminole Springs Rd
- 1614 Seminole Springs Rd
- 1618 Moss Creek Rd