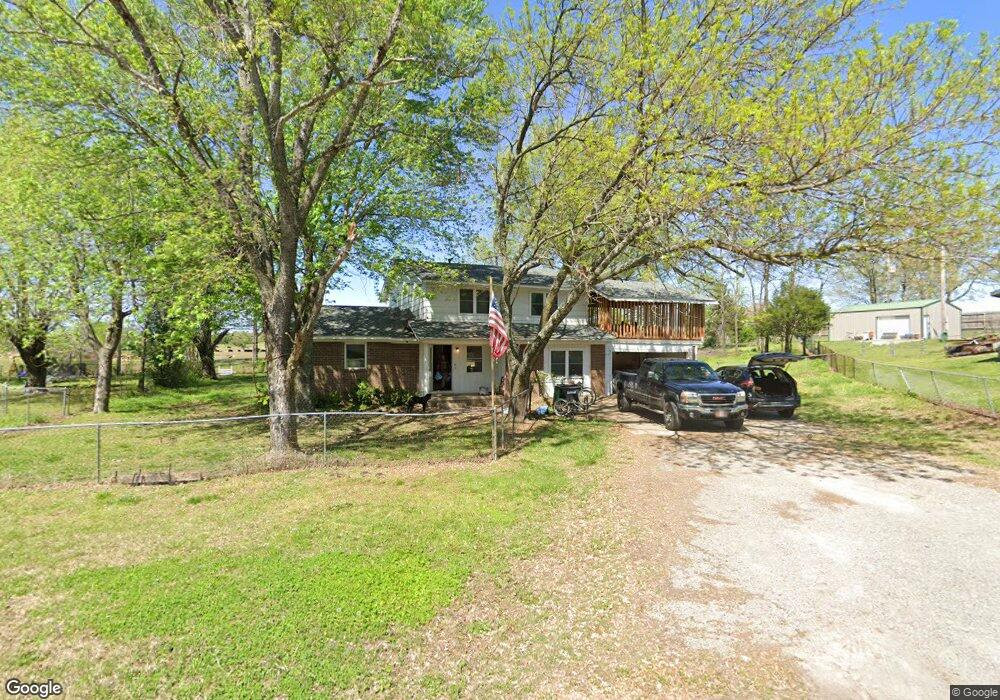
1612 Clayton Dr Unit B Tahlequah, OK 74464
Estimated Value: $230,000 - $277,000
2
Beds
1
Bath
2,084
Sq Ft
$121/Sq Ft
Est. Value
About This Home
This home is located at 1612 Clayton Dr Unit B, Tahlequah, OK 74464 and is currently estimated at $251,834, approximately $120 per square foot. 1612 Clayton Dr Unit B is a home located in Cherokee County with nearby schools including Grand View Public School, Agape Christian Academy, and Shiloh Christian School.
Ownership History
Date
Name
Owned For
Owner Type
Purchase Details
Closed on
Aug 22, 2024
Sold by
Frost Amy and Holman Rebecca
Bought by
Rentals At Mk Ranch Llc
Current Estimated Value
Home Financials for this Owner
Home Financials are based on the most recent Mortgage that was taken out on this home.
Original Mortgage
$195,500
Outstanding Balance
$186,224
Interest Rate
5.63%
Mortgage Type
New Conventional
Estimated Equity
$65,610
Purchase Details
Closed on
Jul 19, 2022
Sold by
Blackwell William R and Blackwell Autumn
Bought by
Frost Amy
Purchase Details
Closed on
May 14, 2018
Sold by
Harmon Patrick William and Harmon Sharon Lynne
Bought by
Blackwell William R
Home Financials for this Owner
Home Financials are based on the most recent Mortgage that was taken out on this home.
Original Mortgage
$127,187
Interest Rate
4.4%
Mortgage Type
New Conventional
Create a Home Valuation Report for This Property
The Home Valuation Report is an in-depth analysis detailing your home's value as well as a comparison with similar homes in the area
Home Values in the Area
Average Home Value in this Area
Purchase History
| Date | Buyer | Sale Price | Title Company |
|---|---|---|---|
| Rentals At Mk Ranch Llc | $230,000 | None Listed On Document | |
| Frost Amy | $121,000 | None Listed On Document | |
| Blackwell William R | $125,000 | Tahlequah Abstract & Title C |
Source: Public Records
Mortgage History
| Date | Status | Borrower | Loan Amount |
|---|---|---|---|
| Open | Rentals At Mk Ranch Llc | $195,500 | |
| Previous Owner | Blackwell William R | $127,187 |
Source: Public Records
Tax History Compared to Growth
Tax History
| Year | Tax Paid | Tax Assessment Tax Assessment Total Assessment is a certain percentage of the fair market value that is determined by local assessors to be the total taxable value of land and additions on the property. | Land | Improvement |
|---|---|---|---|---|
| 2025 | $1,160 | $25,300 | $1,760 | $23,540 |
| 2024 | $1,160 | $13,976 | $1,159 | $12,817 |
| 2023 | $1,160 | $13,310 | $851 | $12,459 |
| 2022 | $976 | $13,750 | $880 | $12,870 |
| 2021 | $976 | $13,750 | $880 | $12,870 |
| 2020 | $976 | $13,750 | $880 | $12,870 |
| 2019 | $1,066 | $13,750 | $880 | $12,870 |
| 2018 | $644 | $8,247 | $880 | $7,367 |
| 2017 | $617 | $7,854 | $880 | $6,974 |
| 2016 | $591 | $7,480 | $880 | $6,600 |
| 2015 | $535 | $7,124 | $880 | $6,244 |
| 2014 | $535 | $6,785 | $556 | $6,229 |
Source: Public Records
Map
Nearby Homes
- 780 W Southlake Dr
- 1471 N Angus Ave
- 511 W Allen Rd
- 3063 Mountain
- 1032 Watercolor
- 1189 Watercolor
- 15300 N Jarvis
- 1188 Watercolor
- 978 Seagrove
- 1281 Watercolor
- 15350 Hwy 62
- 907 Watercolor
- 961 Watercolor
- 892 Watercolor
- 3058 Mountain
- 1242 Watercolor
- 947 Seagrove
- 1221 Watercolor
- 1074 Watercolor
- 850 Grayton
- 1612 Clayton Dr
- 1612 Clayton Dr Unit 1
- 1612 Clayton Dr Unit 2
- 1610 Clayton Dr
- 1614 Clayton Dr
- 1616 Clayton Dr
- 1608 Clayton Dr
- 857 W Northlake Dr
- 1611 Clayton Dr
- 1615 Clayton Dr
- 1606 Clayton Dr
- 1620 Clayton Dr
- 1601 Clayton Dr
- 1619 Clayton Dr
- 904 Sleepy St
- 1602 Clayton Dr
- 1624 Clayton Dr
- 824 W Northlake Dr
- 908 Sleepy St
- 1606 N Sleepy Hollow Ln