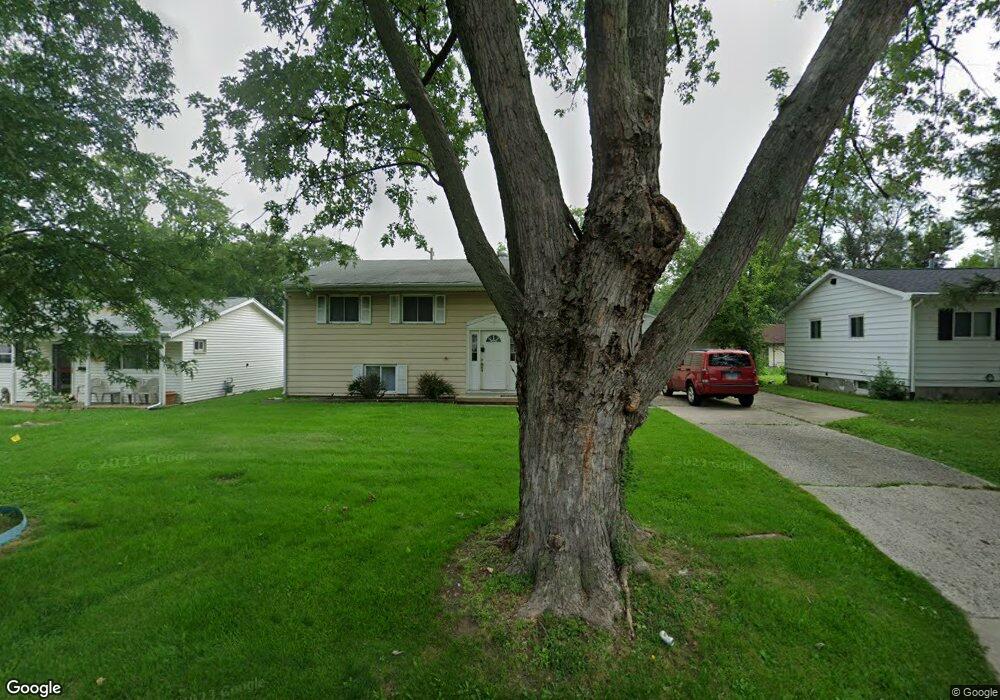
1612 Cruising Ln Unit 1 Champaign, IL 61821
Garden Hills NeighborhoodEstimated Value: $105,738 - $227,000
3
Beds
2
Baths
1,975
Sq Ft
$73/Sq Ft
Est. Value
About This Home
This home is located at 1612 Cruising Ln Unit 1, Champaign, IL 61821 and is currently estimated at $144,685, approximately $73 per square foot. 1612 Cruising Ln Unit 1 is a home located in Champaign County with nearby schools including Centennial High School, Judah Christian School, and St. John Lutheran School.
Ownership History
Date
Name
Owned For
Owner Type
Purchase Details
Closed on
Oct 10, 2025
Sold by
Jal Properties Llc
Bought by
Garden Hills Rentals Llc
Current Estimated Value
Home Financials for this Owner
Home Financials are based on the most recent Mortgage that was taken out on this home.
Original Mortgage
$176,000
Outstanding Balance
$176,000
Interest Rate
6.56%
Mortgage Type
New Conventional
Estimated Equity
-$31,315
Purchase Details
Closed on
Aug 31, 2015
Sold by
Illini Home Buyers Llc
Bought by
Jal Properties Llc
Home Financials for this Owner
Home Financials are based on the most recent Mortgage that was taken out on this home.
Original Mortgage
$79,012
Interest Rate
3.57%
Mortgage Type
Future Advance Clause Open End Mortgage
Purchase Details
Closed on
May 31, 2006
Sold by
Davis Georgia L and Davis Ricky B
Bought by
Efta Donald H and Efta Monique S
Home Financials for this Owner
Home Financials are based on the most recent Mortgage that was taken out on this home.
Original Mortgage
$86,985
Interest Rate
6.62%
Mortgage Type
FHA
Create a Home Valuation Report for This Property
The Home Valuation Report is an in-depth analysis detailing your home's value as well as a comparison with similar homes in the area
Home Values in the Area
Average Home Value in this Area
Purchase History
| Date | Buyer | Sale Price | Title Company |
|---|---|---|---|
| Garden Hills Rentals Llc | $80,000 | Chicago Title | |
| Jal Properties Llc | $45,000 | None Available | |
| Efta Donald H | $88,500 | None Available |
Source: Public Records
Mortgage History
| Date | Status | Borrower | Loan Amount |
|---|---|---|---|
| Open | Garden Hills Rentals Llc | $176,000 | |
| Previous Owner | Jal Properties Llc | $79,012 | |
| Previous Owner | Efta Donald H | $86,985 |
Source: Public Records
Tax History Compared to Growth
Tax History
| Year | Tax Paid | Tax Assessment Tax Assessment Total Assessment is a certain percentage of the fair market value that is determined by local assessors to be the total taxable value of land and additions on the property. | Land | Improvement |
|---|---|---|---|---|
| 2024 | $1,121 | $13,650 | $6,830 | $6,820 |
| 2023 | $1,121 | $12,430 | $6,220 | $6,210 |
| 2022 | $1,055 | $11,470 | $5,740 | $5,730 |
| 2021 | $1,030 | $11,250 | $5,630 | $5,620 |
| 2020 | $1,031 | $11,250 | $5,630 | $5,620 |
| 2019 | $998 | $11,010 | $5,510 | $5,500 |
| 2018 | $975 | $10,830 | $5,420 | $5,410 |
| 2017 | $436 | $10,830 | $5,420 | $5,410 |
| 2016 | $381 | $10,610 | $5,310 | $5,300 |
| 2015 | $376 | $10,430 | $5,220 | $5,210 |
| 2014 | $1,437 | $23,080 | $5,220 | $17,860 |
| 2013 | $1,424 | $23,080 | $5,220 | $17,860 |
Source: Public Records
Map
Nearby Homes
- 1516 N Mattis Ave
- 1503 Summit Ridge Rd
- 1511 Paula Dr
- 1504 N Mattis Ave
- 1315 Williamsburg Dr
- 2213 Roland Dr
- 1604 Kirk Ln
- 1507 N Mckinley Ave
- 1204 W Beardsley Ave
- 1507 N Ridgeway Ave
- 2504 Campbell Dr
- 1507 W Columbia Ave
- 2416 Heritage Dr
- 1009 N Prospect Ave
- 515 Clearwater Dr Unit 515
- 1704 W Church St
- 1710 W Church St
- 303 N Draper Ave
- 2712 Heritage Dr Unit 2712
- 1311 W Hill St
- 1612 Cruising Ln
- 1610 Cruising Ln
- 1614 Cruising Ln
- 1617 Hedge Rd
- 1619 Hedge Rd
- 1619 Hedge Rd Unit 1
- 1615 Hedge Rd
- 1608 Cruising Ln
- 1616 Cruising Ln
- 1701 Hedge Rd
- 1611 Cruising Ln
- 1613 Cruising Ln
- 1613 Hedge Rd
- 1609 Cruising Ln
- 1606 Cruising Ln
- 1514 Summit Ridge Rd
- 1602 Summit Ridge Rd
- 1607 Cruising Ln
- 1611 Hedge Rd
- 1604 Cruising Ln