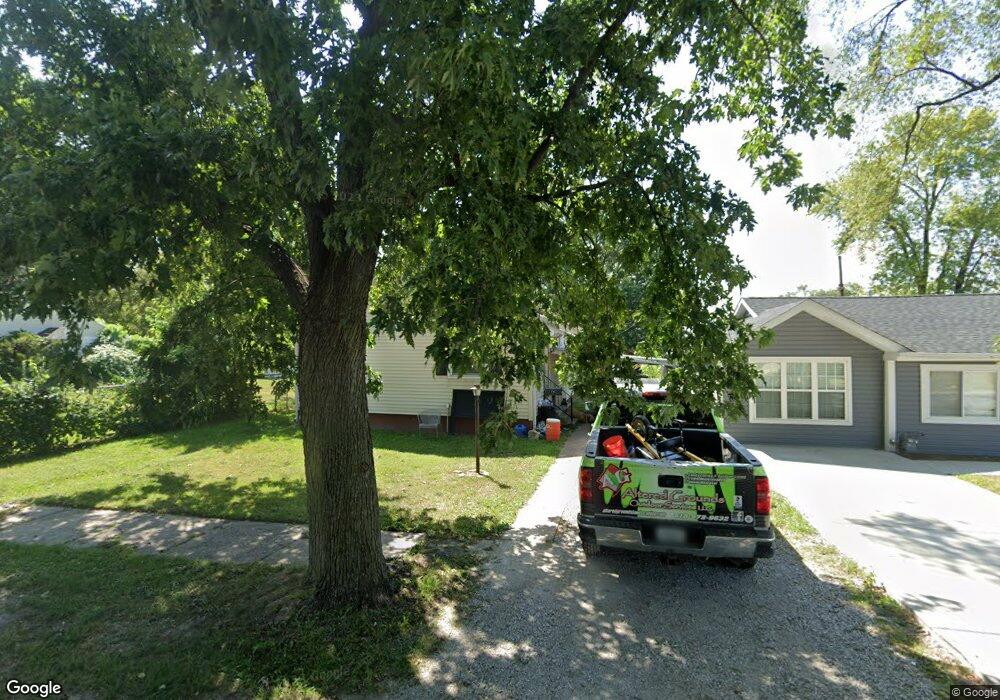
1612 Ferguson Ave Granite City, IL 62040
Estimated Value: $71,000 - $94,778
2
Beds
1
Bath
960
Sq Ft
$85/Sq Ft
Est. Value
About This Home
This home is located at 1612 Ferguson Ave, Granite City, IL 62040 and is currently estimated at $81,695, approximately $85 per square foot. 1612 Ferguson Ave is a home located in Madison County with nearby schools including Granite City High School, St. Elizabeth Elementary School, and Metro East Montessori School.
Ownership History
Date
Name
Owned For
Owner Type
Purchase Details
Closed on
Dec 3, 2018
Sold by
Bracamontes John and Bracamontes Jessica
Bought by
Bracamontes John and Bracamontes Jessica
Current Estimated Value
Home Financials for this Owner
Home Financials are based on the most recent Mortgage that was taken out on this home.
Original Mortgage
$34,899
Outstanding Balance
$30,635
Interest Rate
4.62%
Mortgage Type
FHA
Estimated Equity
$51,060
Purchase Details
Closed on
Dec 21, 2007
Sold by
Milton Cynthia Ann
Bought by
Bracamontes John and Bruce Jessica
Home Financials for this Owner
Home Financials are based on the most recent Mortgage that was taken out on this home.
Original Mortgage
$47,552
Interest Rate
6.31%
Mortgage Type
FHA
Purchase Details
Closed on
Dec 18, 2007
Sold by
Huelskoetter Mark
Bought by
Milton Cynthia Ann
Home Financials for this Owner
Home Financials are based on the most recent Mortgage that was taken out on this home.
Original Mortgage
$47,552
Interest Rate
6.31%
Mortgage Type
FHA
Create a Home Valuation Report for This Property
The Home Valuation Report is an in-depth analysis detailing your home's value as well as a comparison with similar homes in the area
Home Values in the Area
Average Home Value in this Area
Purchase History
| Date | Buyer | Sale Price | Title Company |
|---|---|---|---|
| Bracamontes John | $75,000 | None Available | |
| Bracamontes John | $47,500 | First American Title Ins Co | |
| Milton Cynthia Ann | -- | First American Title Ins Co |
Source: Public Records
Mortgage History
| Date | Status | Borrower | Loan Amount |
|---|---|---|---|
| Open | Bracamontes John | $34,899 | |
| Previous Owner | Bracamontes John | $47,552 |
Source: Public Records
Tax History Compared to Growth
Tax History
| Year | Tax Paid | Tax Assessment Tax Assessment Total Assessment is a certain percentage of the fair market value that is determined by local assessors to be the total taxable value of land and additions on the property. | Land | Improvement |
|---|---|---|---|---|
| 2024 | $1,344 | $21,980 | $3,390 | $18,590 |
| 2023 | $1,344 | $19,140 | $2,950 | $16,190 |
| 2022 | $1,288 | $17,370 | $2,680 | $14,690 |
| 2021 | $1,192 | $16,510 | $2,550 | $13,960 |
| 2020 | $1,160 | $15,980 | $2,470 | $13,510 |
| 2019 | $1,271 | $16,950 | $2,420 | $14,530 |
| 2018 | $1,250 | $15,980 | $2,280 | $13,700 |
| 2017 | $1,216 | $15,980 | $2,280 | $13,700 |
| 2016 | $1,308 | $15,980 | $2,280 | $13,700 |
| 2015 | $1,225 | $16,030 | $2,290 | $13,740 |
| 2014 | $1,225 | $16,030 | $2,290 | $13,740 |
| 2013 | $1,225 | $16,470 | $2,350 | $14,120 |
Source: Public Records
Map
Nearby Homes
- 1633 Sycamore St
- 1728 Ferguson Ave
- 1732 Sycamore St
- 1608 Union Ave
- 1612 Venice Ave
- 2132 Orville Ave
- 2152 Bern Ave
- 1737 Moro Ave
- 2125 Lynch Ave
- 1612 Mitchell Ave
- 2216 Woodlawn Ave
- 4104 Braden Ave
- 50 Janday Ln
- 3805 Fair Oaks Dr
- 4023 Braden Ave
- 2345 Paul Ave
- 1517 Garfield Ave
- 2305 Clinton Dr
- 3424 Lydia Ln
- 1511 Cottage Ave
- 1610 Ferguson Ave
- 1616 Ferguson Ave
- 1608 Ferguson Ave
- 1609 Bremen Ave
- 1606 Ferguson Ave
- 1620 Ferguson Ave
- 1609 Ferguson Ave
- 1617 Bremen Ave
- 1621 Ferguson Ave
- 1625 Ferguson Ave
- 1628 Ferguson Ave
- 1621 Bremen Ave
- 4300 Nameoki Rd
- 4300 Nameoki Rd
- 1616 Courtney Blvd
- 1629 Ferguson Ave
- 1604 Bremen Ave
- 1608 Bremen Ave
- 1614 Courtney Blvd
- 1633 Ferguson Ave