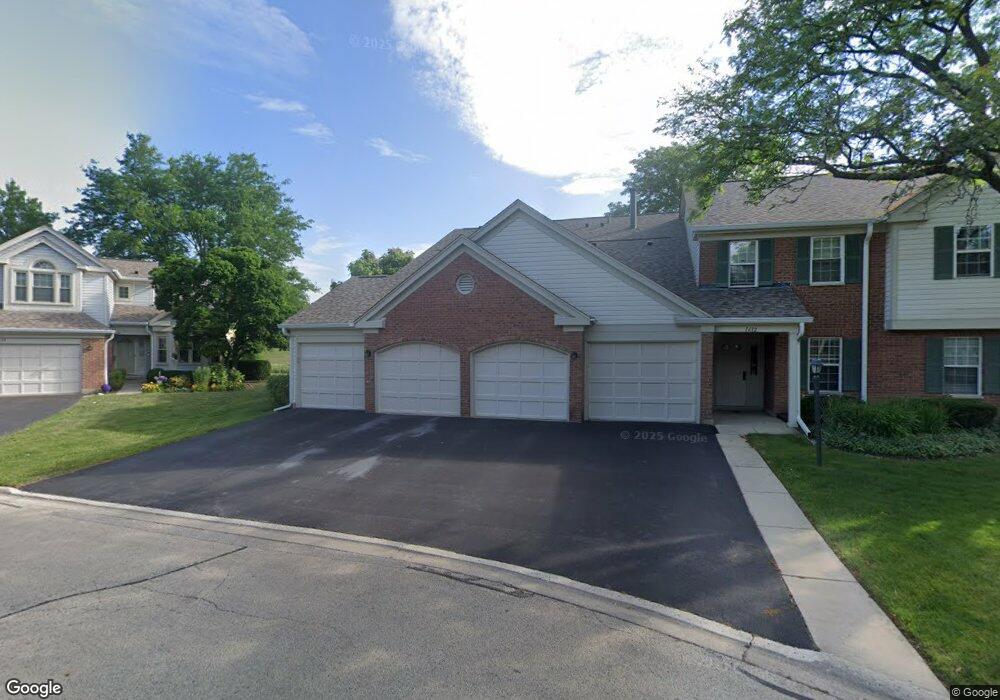
1612 Hadley Ct Unit 12731 Wheeling, IL 60090
Estimated Value: $230,000 - $253,000
1
Bed
--
Bath
949
Sq Ft
$254/Sq Ft
Est. Value
About This Home
This home is located at 1612 Hadley Ct Unit 12731, Wheeling, IL 60090 and is currently estimated at $240,654, approximately $253 per square foot. 1612 Hadley Ct Unit 12731 is a home located in Cook County with nearby schools including Joyce Kilmer Elementary School, Cooper Middle School, and Buffalo Grove High School.
Ownership History
Date
Name
Owned For
Owner Type
Purchase Details
Closed on
Feb 21, 2018
Sold by
Clausen Lori L
Bought by
Clausen Lori L and Lori L Clausen Declaration Of Trust
Current Estimated Value
Purchase Details
Closed on
Nov 16, 2017
Sold by
Ezlakowska Zofia
Bought by
Clausen Lori L
Purchase Details
Closed on
Jul 23, 2007
Sold by
Price Dane J
Bought by
Ezlakowska Zofia
Home Financials for this Owner
Home Financials are based on the most recent Mortgage that was taken out on this home.
Original Mortgage
$162,000
Interest Rate
6.5%
Mortgage Type
Unknown
Purchase Details
Closed on
May 1, 2002
Sold by
Banco Popular North America
Bought by
Mastro Emily and The Emily Mastro Living Trust
Purchase Details
Closed on
Jun 21, 2001
Sold by
Mastro Emily M
Bought by
Price Dane J
Home Financials for this Owner
Home Financials are based on the most recent Mortgage that was taken out on this home.
Original Mortgage
$134,500
Interest Rate
5.87%
Create a Home Valuation Report for This Property
The Home Valuation Report is an in-depth analysis detailing your home's value as well as a comparison with similar homes in the area
Home Values in the Area
Average Home Value in this Area
Purchase History
| Date | Buyer | Sale Price | Title Company |
|---|---|---|---|
| Clausen Lori L | -- | None Available | |
| Clausen Lori L | $155,000 | Attorney | |
| Ezlakowska Zofia | $180,000 | Republic Title Co | |
| Mastro Emily | -- | -- | |
| Price Dane J | $149,500 | -- |
Source: Public Records
Mortgage History
| Date | Status | Borrower | Loan Amount |
|---|---|---|---|
| Previous Owner | Ezlakowska Zofia | $162,000 | |
| Previous Owner | Price Dane J | $134,500 |
Source: Public Records
Tax History Compared to Growth
Tax History
| Year | Tax Paid | Tax Assessment Tax Assessment Total Assessment is a certain percentage of the fair market value that is determined by local assessors to be the total taxable value of land and additions on the property. | Land | Improvement |
|---|---|---|---|---|
| 2024 | $4,062 | $15,437 | $3,158 | $12,279 |
| 2023 | $3,840 | $15,437 | $3,158 | $12,279 |
| 2022 | $3,840 | $15,437 | $3,158 | $12,279 |
| 2021 | $3,692 | $13,296 | $526 | $12,770 |
| 2020 | $3,678 | $13,296 | $526 | $12,770 |
| 2019 | $3,752 | $14,879 | $526 | $14,353 |
| 2018 | $2,914 | $11,420 | $421 | $10,999 |
| 2017 | $2,876 | $11,420 | $421 | $10,999 |
| 2016 | $2,977 | $11,420 | $421 | $10,999 |
| 2015 | $2,346 | $9,206 | $1,789 | $7,417 |
| 2014 | $2,307 | $9,206 | $1,789 | $7,417 |
| 2013 | $2,110 | $9,206 | $1,789 | $7,417 |
Source: Public Records
Map
Nearby Homes
- 1519 Acorn Ct Unit 1989N
- 51 Old Oak Dr Unit 302
- 51 Old Oak Dr Unit 414
- 50 Lake Blvd Unit 632
- 10 Old Oak Dr Unit 103
- 400 E Dundee Rd Unit 207C
- 12 Oak Creek Dr Unit 2212
- 150 Lake Blvd Unit 154
- 150 Lake Blvd Unit 125
- 443 Diane Dr
- 175 Lake Blvd Unit 308
- 565 Fairway View Dr Unit 2L
- 416 Trinity Ct
- 200 Lake Blvd Unit 439
- 571 Fairway View Dr Unit 2J
- 133 Coral Ln
- 3401 N Ellen Dr
- 234 Mohawk Trail
- 577 Fairway View Dr Unit 1J
- 98 Glendale Rd
- 1612 Hadley Ct Unit A1
- 1612 Hadley Ct Unit 12731
- 1612 Hadley Ct Unit 12731
- 1612 Hadley Ct Unit 12731
- 1612 Hadley Ct Unit A2
- 1612 Hadley Ct Unit B2
- 1614 Hadley Ct Unit 12731
- 1614 Hadley Ct Unit 12731
- 1614 Hadley Ct Unit 12731
- 1614 Hadley Ct Unit 12731
- 1614 Hadley Ct Unit C2
- 1614 Hadley Ct Unit D1
- 1610 Hadley Ct Unit 12732
- 1610 Hadley Ct Unit O
- 1608 Hadley Ct Unit 12732
- 1606 Hadley Ct Unit 12732
- 1616 Hadley Ct Unit 13130
- 1616 Hadley Ct Unit 13130
- 1616 Hadley Ct Unit 13130
- 1616 Hadley Ct Unit 13130