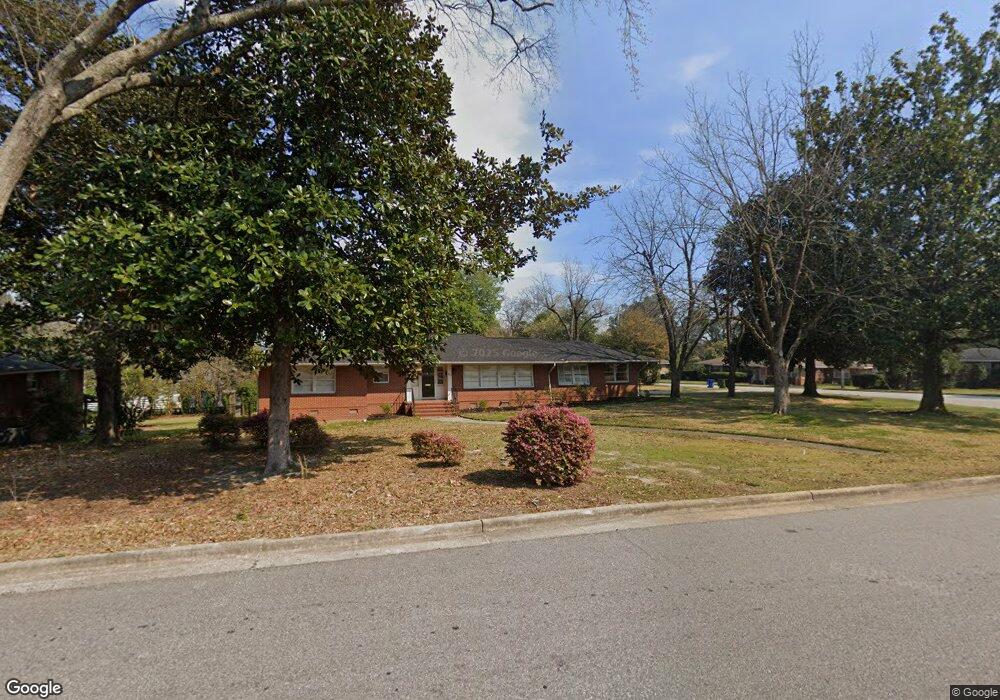
1612 Iris Dr Columbus, GA 31906
Wynnton Grove NeighborhoodEstimated Value: $261,818 - $360,000
3
Beds
3
Baths
2,191
Sq Ft
$135/Sq Ft
Est. Value
About This Home
This home is located at 1612 Iris Dr, Columbus, GA 31906 and is currently estimated at $296,205, approximately $135 per square foot. 1612 Iris Dr is a home located in Muscogee County with nearby schools including Clubview Elementary School, Richards Middle School, and Hardaway High School.
Ownership History
Date
Name
Owned For
Owner Type
Purchase Details
Closed on
Jul 7, 2017
Sold by
Carter John R
Bought by
Mcbroom Cody Shane and Mcbroom Summer H
Current Estimated Value
Home Financials for this Owner
Home Financials are based on the most recent Mortgage that was taken out on this home.
Original Mortgage
$221,665
Outstanding Balance
$184,166
Interest Rate
3.89%
Mortgage Type
VA
Estimated Equity
$112,039
Create a Home Valuation Report for This Property
The Home Valuation Report is an in-depth analysis detailing your home's value as well as a comparison with similar homes in the area
Home Values in the Area
Average Home Value in this Area
Purchase History
| Date | Buyer | Sale Price | Title Company |
|---|---|---|---|
| Mcbroom Cody Shane | $217,000 | -- | |
| Carter John R | -- | -- |
Source: Public Records
Mortgage History
| Date | Status | Borrower | Loan Amount |
|---|---|---|---|
| Open | Carter John R | $221,665 | |
| Closed | Mcbroom Cody Shane | $221,665 |
Source: Public Records
Tax History
| Year | Tax Paid | Tax Assessment Tax Assessment Total Assessment is a certain percentage of the fair market value that is determined by local assessors to be the total taxable value of land and additions on the property. | Land | Improvement |
|---|---|---|---|---|
| 2025 | $3,476 | $88,804 | $19,380 | $69,424 |
| 2024 | $3,794 | $96,928 | $19,380 | $77,548 |
| 2023 | $3,818 | $96,928 | $19,380 | $77,548 |
| 2022 | $3,449 | $84,476 | $19,380 | $65,096 |
| 2021 | $2,997 | $73,400 | $19,380 | $54,020 |
| 2020 | $2,998 | $73,400 | $19,380 | $54,020 |
| 2019 | $3,007 | $73,400 | $19,380 | $54,020 |
| 2018 | $3,007 | $73,400 | $19,380 | $54,020 |
| 2017 | $3,050 | $73,400 | $19,380 | $54,020 |
| 2016 | $3,059 | $81,999 | $12,130 | $69,869 |
| 2015 | $3,067 | $81,999 | $12,130 | $69,869 |
| 2014 | $3,071 | $81,999 | $12,130 | $69,869 |
| 2013 | -- | $87,520 | $12,130 | $75,390 |
Source: Public Records
Map
Nearby Homes
Your Personal Tour Guide
Ask me questions while you tour the home.