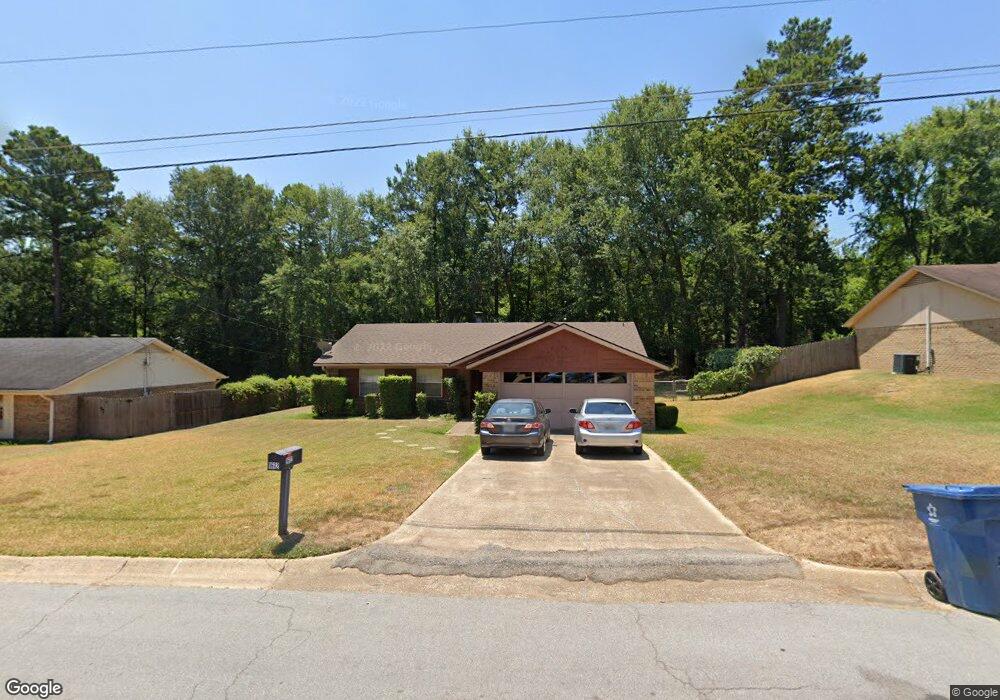
1612 Leach St Kilgore, TX 75662
Estimated Value: $206,000 - $242,000
--
Bed
--
Bath
1,463
Sq Ft
$156/Sq Ft
Est. Value
About This Home
This home is located at 1612 Leach St, Kilgore, TX 75662 and is currently estimated at $227,938, approximately $155 per square foot. 1612 Leach St is a home located in Rusk County with nearby schools including Kilgore Primary School, Chandler Elementary School, and Kilgore Intermediate School.
Ownership History
Date
Name
Owned For
Owner Type
Purchase Details
Closed on
Feb 5, 2025
Sold by
H4s Holdings Lp
Bought by
Luna Rafel and Bailey Murrell
Current Estimated Value
Home Financials for this Owner
Home Financials are based on the most recent Mortgage that was taken out on this home.
Original Mortgage
$197,500
Outstanding Balance
$194,751
Interest Rate
6.85%
Mortgage Type
Seller Take Back
Estimated Equity
$33,187
Create a Home Valuation Report for This Property
The Home Valuation Report is an in-depth analysis detailing your home's value as well as a comparison with similar homes in the area
Home Values in the Area
Average Home Value in this Area
Purchase History
| Date | Buyer | Sale Price | Title Company |
|---|---|---|---|
| Luna Rafel | -- | None Listed On Document | |
| Luna Rafel | -- | None Listed On Document |
Source: Public Records
Mortgage History
| Date | Status | Borrower | Loan Amount |
|---|---|---|---|
| Open | Luna Rafel | $197,500 | |
| Closed | Luna Rafel | $197,500 |
Source: Public Records
Tax History Compared to Growth
Tax History
| Year | Tax Paid | Tax Assessment Tax Assessment Total Assessment is a certain percentage of the fair market value that is determined by local assessors to be the total taxable value of land and additions on the property. | Land | Improvement |
|---|---|---|---|---|
| 2024 | $3,625 | $158,360 | $30,000 | $128,360 |
| 2023 | $3,246 | $146,110 | $30,000 | $116,110 |
| 2022 | $3,263 | $125,800 | $20,000 | $105,800 |
| 2021 | $2,769 | $109,050 | $20,000 | $89,050 |
| 2020 | $2,640 | $109,050 | $20,000 | $89,050 |
| 2019 | $2,707 | $103,890 | $20,000 | $83,890 |
| 2018 | $2,769 | $103,890 | $20,000 | $83,890 |
| 2017 | $2,674 | $103,890 | $20,000 | $83,890 |
| 2016 | $2,674 | $103,890 | $20,000 | $83,890 |
| 2015 | -- | $103,890 | $20,000 | $83,890 |
| 2014 | -- | $96,750 | $20,000 | $76,750 |
Source: Public Records
Map
Nearby Homes