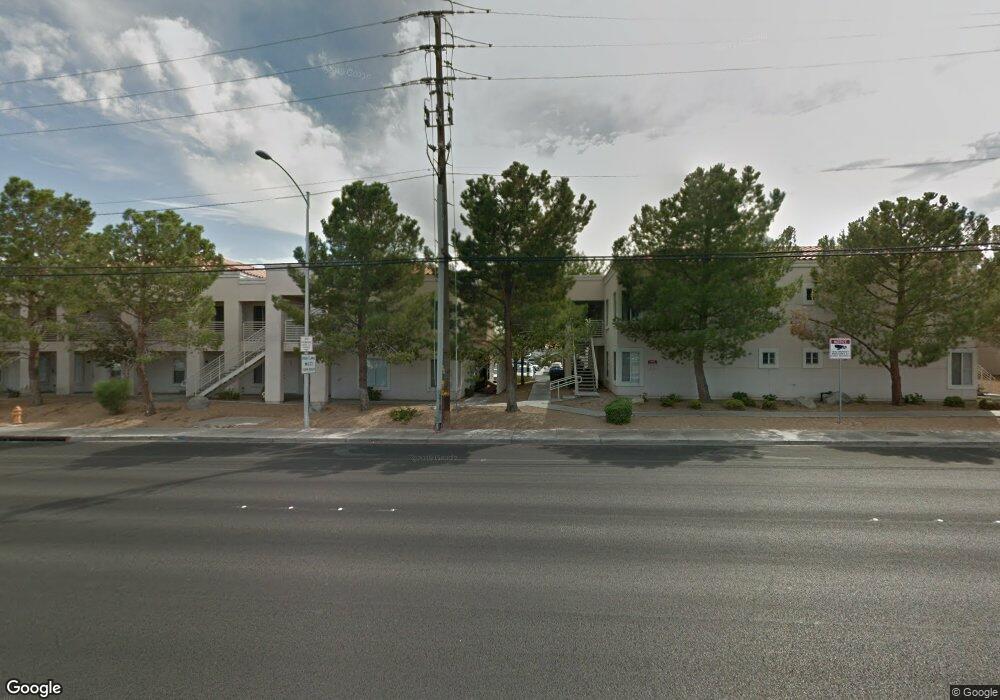
1612 N Torey Pns Dr Unit 101 Las Vegas, NV 89108
Michael Way NeighborhoodEstimated Value: $257,000 - $276,000
2
Beds
2
Baths
1,216
Sq Ft
$216/Sq Ft
Est. Value
About This Home
This home is located at 1612 N Torey Pns Dr Unit 101, Las Vegas, NV 89108 and is currently estimated at $262,579, approximately $215 per square foot. 1612 N Torey Pns Dr Unit 101 is a home located in Clark County with nearby schools including Paul E. Culley Elementary School, J. Harold Brinley Middle School, and Western High School.
Ownership History
Date
Name
Owned For
Owner Type
Purchase Details
Closed on
Jan 30, 2025
Sold by
Cooper Wendy Lee
Bought by
Pawlak Kris and Pawlak Kristina
Current Estimated Value
Purchase Details
Closed on
Nov 2, 2018
Sold by
Segreto Dorothy A
Bought by
Cooper Wendy Lee
Purchase Details
Closed on
Feb 9, 2015
Sold by
Segreto Dorothy A and Segreto Frank P
Bought by
Segreto Dorothy A
Purchase Details
Closed on
Jan 12, 2004
Sold by
Torres Ferdinand
Bought by
Peterson Dorothy A
Home Financials for this Owner
Home Financials are based on the most recent Mortgage that was taken out on this home.
Original Mortgage
$88,100
Interest Rate
5.62%
Mortgage Type
Unknown
Create a Home Valuation Report for This Property
The Home Valuation Report is an in-depth analysis detailing your home's value as well as a comparison with similar homes in the area
Home Values in the Area
Average Home Value in this Area
Purchase History
| Date | Buyer | Sale Price | Title Company |
|---|---|---|---|
| Pawlak Kris | $270,000 | Ticor Title | |
| Cooper Wendy Lee | -- | Ticor Title | |
| Cooper Wendy Lee | $145,000 | Premier American Title | |
| Segreto Dorothy A | -- | Chicago Title Las Vegas | |
| Peterson Dorothy A | $117,500 | Ticor Title Of Nevada Inc |
Source: Public Records
Mortgage History
| Date | Status | Borrower | Loan Amount |
|---|---|---|---|
| Previous Owner | Peterson Dorothy A | $88,100 | |
| Closed | Peterson Dorothy A | $29,375 |
Source: Public Records
Tax History Compared to Growth
Tax History
| Year | Tax Paid | Tax Assessment Tax Assessment Total Assessment is a certain percentage of the fair market value that is determined by local assessors to be the total taxable value of land and additions on the property. | Land | Improvement |
|---|---|---|---|---|
| 2025 | $717 | $41,881 | $13,650 | $28,231 |
| 2024 | $697 | $41,881 | $13,650 | $28,231 |
| 2023 | $697 | $46,359 | $19,950 | $26,409 |
| 2022 | $677 | $41,289 | $16,800 | $24,489 |
| 2021 | $657 | $38,214 | $14,350 | $23,864 |
| 2020 | $635 | $36,096 | $12,250 | $23,846 |
| 2019 | $616 | $32,910 | $9,100 | $23,810 |
| 2018 | $598 | $28,901 | $5,600 | $23,301 |
| 2017 | $958 | $29,228 | $5,250 | $23,978 |
| 2016 | $562 | $27,265 | $4,200 | $23,065 |
| 2015 | $559 | $22,988 | $3,850 | $19,138 |
| 2014 | $543 | $22,100 | $2,800 | $19,300 |
Source: Public Records
Map
Nearby Homes
- 1624 N Torrey Pines Dr Unit 104
- 1620 N Torrey Pines Dr Unit 203
- 1608 N Torrey Pines Dr Unit 103
- 1600 N Torrey Pines Dr Unit 101
- 1600 N Torrey Pines Dr Unit 202
- 1608 Joshua Tree Ct
- 1617 Joshua Tree Ct
- 1816 N Torrey Pines Dr
- 6400 Starcrest Dr
- 6378 Canyon Dawn Ave
- 1646 Discus Dr
- 1900 N Torrey Pines Dr Unit 223
- 1900 N Torrey Pines Dr Unit 212
- 1801 Marathon Dr
- 1436 Padre Bay Dr
- 6224 Mandarin Dr
- 6380 Blue Twilight Ct
- 1325 Maplegrove Cir
- 1909 Betsy Ross Dr
- 6520 Lombard Dr
- 1624 N Torey Pns Dr Unit 202
- 1612 N Torey Pns Dr Unit 103
- 1632 N Torey Pns Dr Unit 203
- 1608 N Torey Pns Dr Unit 202
- 1608 N Torey Pns Dr Unit 101
- 1624 N Torey Pns Dr Unit 104
- 1624 N Torey Pns Dr Unit 103
- 1612 N Torey Pns Dr Unit 102
- 1632 N Torey Pns Dr Unit 102
- 1620 N Torey Pns Dr Unit 104
- 1608 N Torey Pns Dr Unit 102
- 1624 N Torey Pns Dr Unit 203
- 1612 N Torey Pns Dr Unit 104
- 1632 N Torey Pns Dr Unit 103
- 1632 N Torey Pns Dr Unit 104
- 1620 N Torey Pns Dr Unit 102
- 1608 N Torey Pns Dr Unit 104
- 1624 N Torey Pns Dr Unit 102
- 1612 N Torey Pns Dr Unit 202
- 1632 N Torey Pns Dr Unit 101