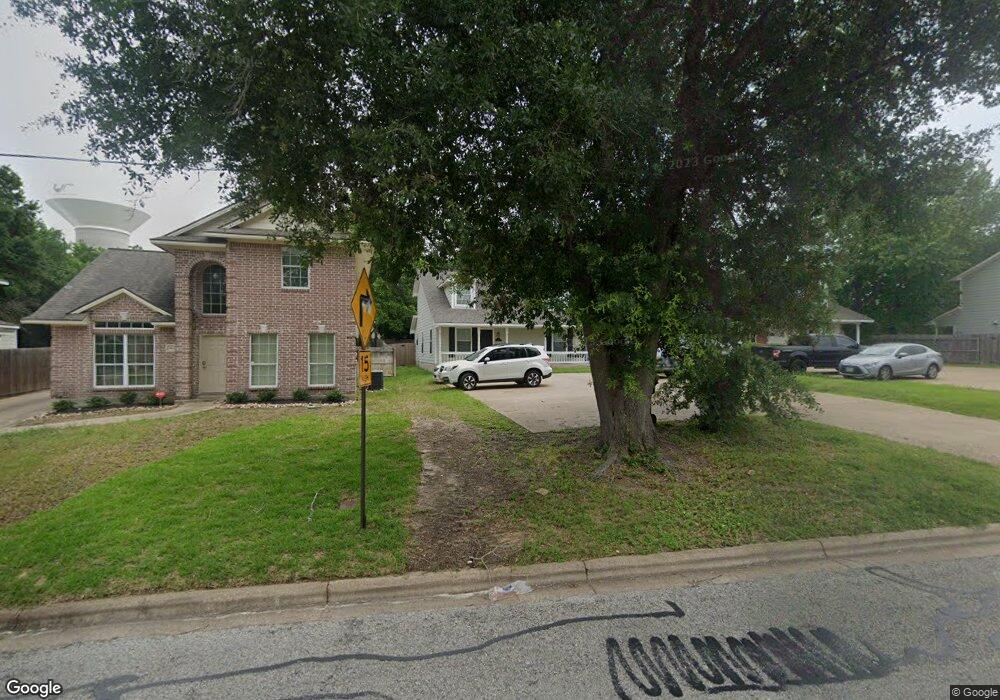
1612 Park Place Unit B College Station, TX 77840
Southside NeighborhoodEstimated Value: $415,433 - $503,000
--
Bed
--
Bath
1,648
Sq Ft
$276/Sq Ft
Est. Value
About This Home
This home is located at 1612 Park Place Unit B, College Station, TX 77840 and is currently estimated at $454,358, approximately $275 per square foot. 1612 Park Place Unit B is a home located in Brazos County with nearby schools including South Knoll Elementary School, A&M Consolidated Middle School, and Oakwood Intermediate School.
Ownership History
Date
Name
Owned For
Owner Type
Purchase Details
Closed on
Dec 31, 2023
Sold by
Cranmer Ross D and Cranmer Zona G
Bought by
1998 Cranmer Family Trust and Cranmer
Current Estimated Value
Purchase Details
Closed on
Jan 27, 2020
Sold by
Cranmer Ross D and Cranmer Zona G
Bought by
Cranmer Ross D and Cranmer Zona G
Home Financials for this Owner
Home Financials are based on the most recent Mortgage that was taken out on this home.
Original Mortgage
$235,875
Interest Rate
3.7%
Mortgage Type
New Conventional
Purchase Details
Closed on
Aug 10, 2011
Sold by
Stone Timothy S and Stone Ginger
Bought by
Cranmer Ross D and Cranmer Zona G
Home Financials for this Owner
Home Financials are based on the most recent Mortgage that was taken out on this home.
Original Mortgage
$175,000
Interest Rate
4.53%
Mortgage Type
Purchase Money Mortgage
Create a Home Valuation Report for This Property
The Home Valuation Report is an in-depth analysis detailing your home's value as well as a comparison with similar homes in the area
Home Values in the Area
Average Home Value in this Area
Purchase History
| Date | Buyer | Sale Price | Title Company |
|---|---|---|---|
| 1998 Cranmer Family Trust | -- | -- | |
| Cranmer Ross D | -- | Old Republic Title | |
| Cranmer Ross D | -- | University Title Company |
Source: Public Records
Mortgage History
| Date | Status | Borrower | Loan Amount |
|---|---|---|---|
| Previous Owner | Cranmer Ross D | $235,875 | |
| Previous Owner | Cranmer Ross D | $175,000 |
Source: Public Records
Tax History Compared to Growth
Tax History
| Year | Tax Paid | Tax Assessment Tax Assessment Total Assessment is a certain percentage of the fair market value that is determined by local assessors to be the total taxable value of land and additions on the property. | Land | Improvement |
|---|---|---|---|---|
| 2025 | $8,658 | $432,551 | $206,639 | $225,912 |
| 2024 | $8,658 | $457,579 | $188,837 | $268,742 |
| 2023 | $8,658 | $436,343 | $168,226 | $268,117 |
| 2022 | $8,055 | $377,813 | $152,923 | $224,890 |
| 2021 | $7,198 | $318,696 | $152,923 | $165,773 |
| 2020 | $6,976 | $307,144 | $152,923 | $154,221 |
| 2019 | $6,545 | $276,990 | $109,700 | $167,290 |
| 2018 | $6,313 | $265,190 | $92,130 | $173,060 |
| 2017 | $5,076 | $215,660 | $75,660 | $140,000 |
| 2016 | $4,892 | $207,840 | $75,660 | $132,180 |
| 2015 | $4,035 | $177,090 | $60,900 | $116,190 |
| 2014 | $4,035 | $174,120 | $60,900 | $113,220 |
Source: Public Records
Map
Nearby Homes
- 1611 Park Place
- 1518 Wolf Run
- 1513 Wolf Run
- 1530 Wolf Run
- 1511 Wolf Run
- 1610 George Bush Dr
- 1612 George Bush Dr
- 9999 Harvey Mitchell S
- 1205 Goode Dr
- 102 A & 100 Sterling St
- 100 Sterling St
- 269 Estates Cir
- 102 Sterling St Unit B
- 102 Sterling St Unit A
- 309 Pershing Ave
- 305 Pershing Ave
- 1500 Glade St
- 318 Kyle Ave
- The Azalea Plan at Greens Prairie Reserve - Elite Series
- The Jasmine Plan at Greens Prairie Reserve - Elite Series
- 1612 Park Place Unit A
- 1614 Park Place
- 1608 Park Place
- 1711 Boardwalk Ct
- 1616 Park Place Unit B
- 1616 Park Place Unit A
- 1616 Park Place
- 1616A Park Place
- 1718 Boardwalk Ct Unit A
- 1718 Boardwalk Ct
- 1606 Park Place
- 1618 Park Place
- 1716 Boardwalk Ct Unit A
- 97 Plantation Blvd
- 1604 Park Place
- 1613 Park Place
- 1707 Boardwalk Ct
- 1615 Park Place
- 1609 Park Place
- 1617 Park Place