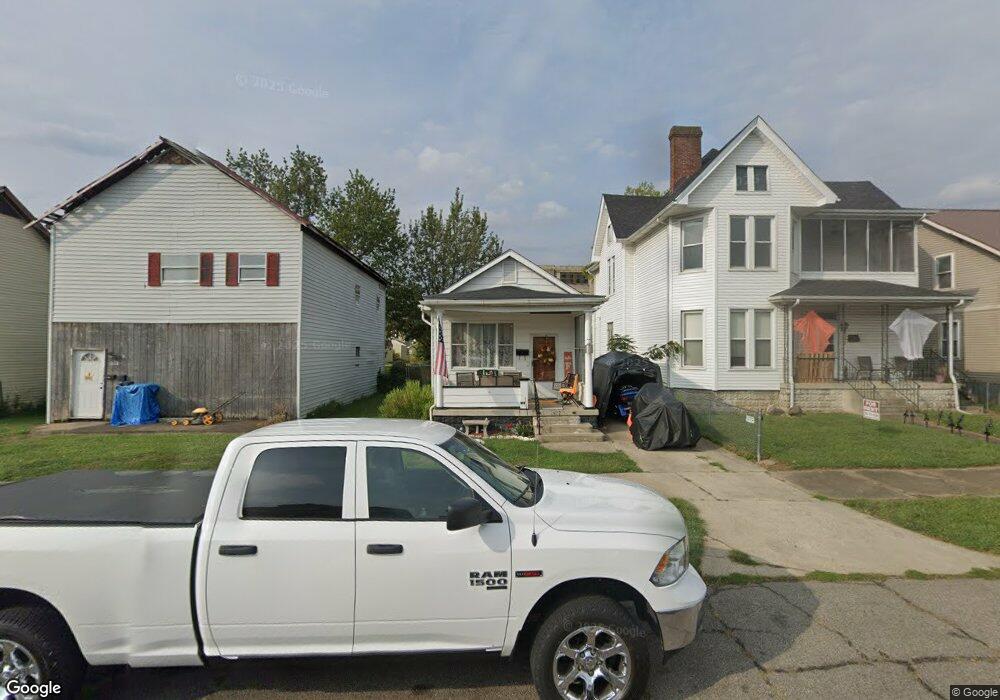
1612 S 4th St Ironton, OH 45638
Estimated Value: $59,000 - $70,000
2
Beds
1
Bath
912
Sq Ft
$71/Sq Ft
Est. Value
About This Home
This home is located at 1612 S 4th St, Ironton, OH 45638 and is currently estimated at $64,731, approximately $70 per square foot. 1612 S 4th St is a home located in Lawrence County with nearby schools including Ironton Elementary School, Ironton Middle School, and Ironton High School.
Ownership History
Date
Name
Owned For
Owner Type
Purchase Details
Closed on
Jun 15, 2023
Sold by
Rac Land Llc
Bought by
Preston Kenneth B
Current Estimated Value
Home Financials for this Owner
Home Financials are based on the most recent Mortgage that was taken out on this home.
Original Mortgage
$45,000
Outstanding Balance
$40,456
Interest Rate
5.75%
Mortgage Type
Balloon
Estimated Equity
$24,275
Purchase Details
Closed on
Aug 24, 2022
Sold by
Robert A Clyse Revocable Trust
Bought by
Rac Land Llc
Purchase Details
Closed on
Aug 11, 2016
Sold by
Johnson Nathan C and Johnson Amanda Faye
Bought by
Rac Ii Ltd
Purchase Details
Closed on
Aug 19, 1999
Sold by
Ball James O and Ball Wini
Bought by
Johnson Nathan C
Purchase Details
Closed on
Feb 24, 1999
Bought by
Ball James O and Ball Wini
Create a Home Valuation Report for This Property
The Home Valuation Report is an in-depth analysis detailing your home's value as well as a comparison with similar homes in the area
Home Values in the Area
Average Home Value in this Area
Purchase History
| Date | Buyer | Sale Price | Title Company |
|---|---|---|---|
| Preston Kenneth B | $50,000 | None Listed On Document | |
| Rac Land Llc | -- | -- | |
| Robert A Clyse Revocable Trust | -- | None Listed On Document | |
| Rac Ii Ltd | -- | None Available | |
| Johnson Nathan C | $33,000 | -- | |
| Ball James O | -- | -- |
Source: Public Records
Mortgage History
| Date | Status | Borrower | Loan Amount |
|---|---|---|---|
| Open | Preston Kenneth B | $45,000 |
Source: Public Records
Tax History Compared to Growth
Tax History
| Year | Tax Paid | Tax Assessment Tax Assessment Total Assessment is a certain percentage of the fair market value that is determined by local assessors to be the total taxable value of land and additions on the property. | Land | Improvement |
|---|---|---|---|---|
| 2024 | -- | $11,350 | $2,730 | $8,620 |
| 2023 | $432 | $11,350 | $2,730 | $8,620 |
| 2022 | $430 | $11,350 | $2,730 | $8,620 |
| 2021 | $473 | $12,280 | $2,540 | $9,740 |
| 2020 | $489 | $12,280 | $2,540 | $9,740 |
| 2019 | $376 | $12,280 | $2,540 | $9,740 |
| 2018 | $492 | $12,280 | $2,540 | $9,740 |
| 2017 | $491 | $12,280 | $2,540 | $9,740 |
| 2016 | $1,073 | $12,280 | $2,540 | $9,740 |
| 2015 | $482 | $12,780 | $2,740 | $10,040 |
| 2014 | $466 | $12,780 | $2,740 | $10,040 |
| 2013 | $465 | $12,780 | $2,740 | $10,040 |
Source: Public Records
Map
Nearby Homes
- 1703 S 5th St
- 1619 S 6th St
- 1525 S 6th St
- 1819 S 6th St
- 1902 S 7th St
- 311 Spruce St
- 1216 S 4th St
- 517 Spruce St
- 707 Mastin Ave
- 1214 S 5th St
- 1214 S 5th St Unit 1216, 1216 1/2 S 5th
- 2121 S 6th St
- 2008 S 9th St
- 2008 S 9th St Unit KO-2
- 914 Pine St
- 914 Pine St
- 0 S 10th St
- 1016 S 5th St
- 1014 S 5th St
- 2322 S 5th St