W
Landlord's Agent in 2019
WILLIAM LESNIAK
Wayne Evans Realty
Estimated Value: $114,243 - $271,000
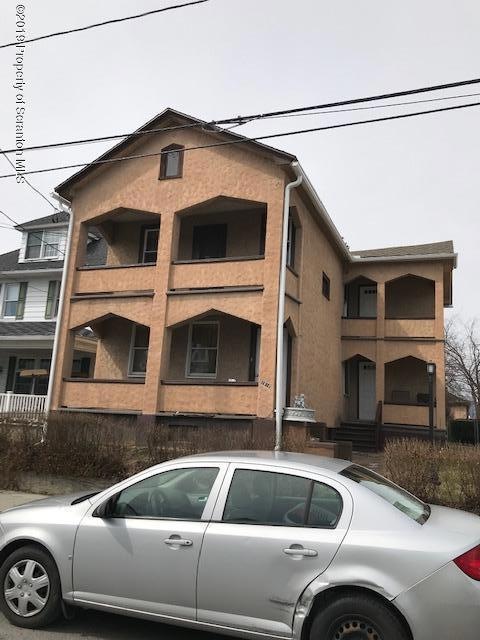
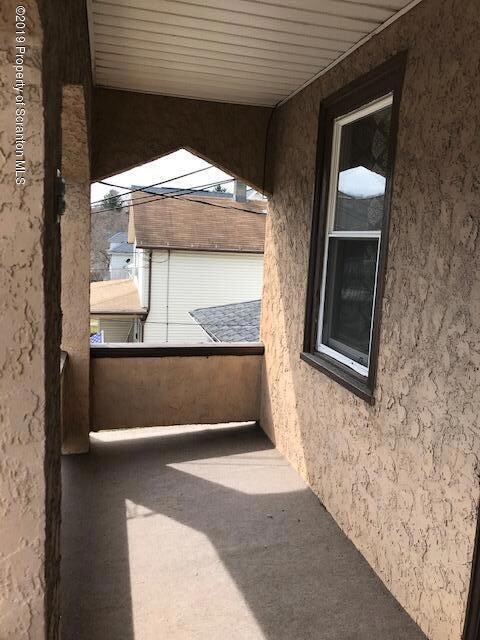
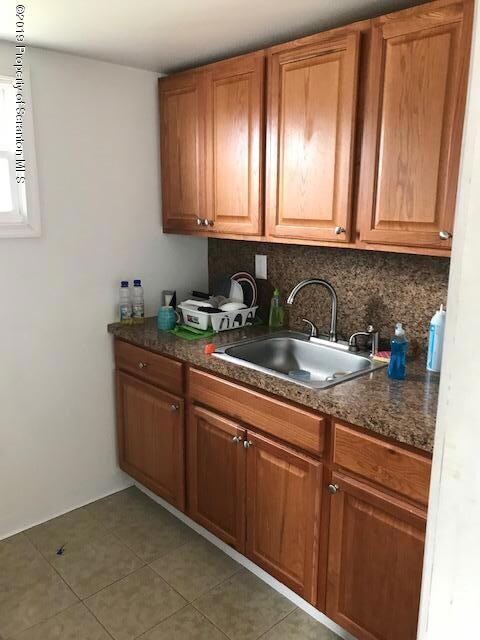
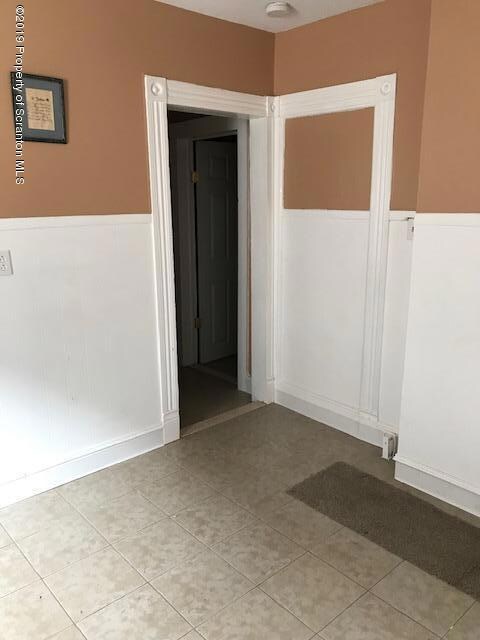
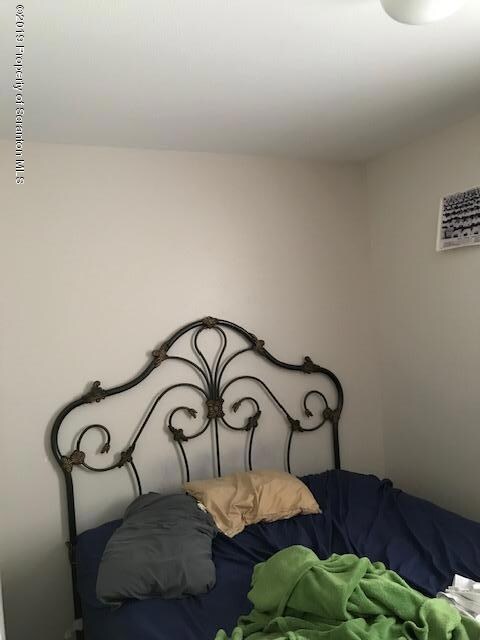
Very nice 2 bedroom apartment in great South Scranton neighborhood. Spacious kitchen and rooms. Private veranda. 2nd floor., Beds: 2+Bed2nd, SqFt Fin - Main: 900.00, SqFt Fin - 3rd: 0.00, Baths: 1 Bath Lev 2, SqFt Fin - 2nd: 900.00, Ttl Lease Term Mnths: 12, Yearly Lease Value: 8100, Comm Paid By: Landlord
Last Agent to Rent the Property
WILLIAM LESNIAK
Wayne Evans Realty License #RS298767 Listed on: 04/03/2019
Last Renter's Agent
WILLIAM LESNIAK
Wayne Evans Realty License #RS298767 Listed on: 04/03/2019
| Date | Buyer | Sale Price | Title Company |
|---|---|---|---|
| Crew Linda | $69,000 | -- | |
| Grebeck Kevin J | $74,500 | -- |
| Date | Status | Borrower | Loan Amount |
|---|---|---|---|
| Open | Crew Linda | $67,750 |
| Date | Event | Price | List to Sale | Price per Sq Ft | Prior Sale |
|---|---|---|---|---|---|
| 05/10/2019 05/10/19 | Rented | $8,100 | +1100.0% | -- | |
| 04/20/2019 04/20/19 | Under Contract | -- | -- | -- | |
| 04/03/2019 04/03/19 | For Rent | $675 | 0.0% | -- | |
| 02/08/2018 02/08/18 | Sold | $69,000 | -25.0% | $45 / Sq Ft | View Prior Sale |
| 12/30/2017 12/30/17 | Pending | -- | -- | -- | |
| 10/20/2016 10/20/16 | For Sale | $92,000 | -- | $60 / Sq Ft |
| Year | Tax Paid | Tax Assessment Tax Assessment Total Assessment is a certain percentage of the fair market value that is determined by local assessors to be the total taxable value of land and additions on the property. | Land | Improvement |
|---|---|---|---|---|
| 2025 | $3,180 | $10,000 | $1,400 | $8,600 |
| 2024 | $2,903 | $10,000 | $1,400 | $8,600 |
| 2023 | $2,903 | $10,000 | $1,400 | $8,600 |
| 2022 | $2,839 | $10,000 | $1,400 | $8,600 |
| 2021 | $2,839 | $10,000 | $1,400 | $8,600 |
| 2020 | $2,786 | $10,000 | $1,400 | $8,600 |
| 2019 | $2,619 | $10,000 | $1,400 | $8,600 |
| 2018 | $2,619 | $10,000 | $1,400 | $8,600 |
| 2017 | $2,572 | $10,000 | $1,400 | $8,600 |
| 2016 | $760 | $10,000 | $1,400 | $8,600 |
| 2015 | $1,923 | $10,000 | $1,400 | $8,600 |
| 2014 | -- | $10,000 | $1,400 | $8,600 |
W
Landlord's Agent in 2019
WILLIAM LESNIAK
Wayne Evans Realty
L
Seller's Agent in 2018
Lori Francis
ERA One Source Realty Scranton
D
Buyer's Agent in 2018
Dan Taylor
Keller Williams Real Estate-Clarks Summit
(215) 860-4200
1 Total Sale
Source: Greater Scranton Board of REALTORS®
MLS Number: GSB191399
APN: 16711030049
Disclaimer: Certain information contained herein is derived from information provided by parties other than Homes.com. All information provided is deemed reliable, but is not guaranteed to be accurate and should be independently verified.
![]() Information provided by the Greater Scranton Board of REALTORS® MLS. Information is for consumer’s personal noncommercial use, and may not be used for any purpose other than identifying properties which consumers may be interested in purchasing. Consult the specific municipality for permitted Zoning uses.
Information provided by the Greater Scranton Board of REALTORS® MLS. Information is for consumer’s personal noncommercial use, and may not be used for any purpose other than identifying properties which consumers may be interested in purchasing. Consult the specific municipality for permitted Zoning uses.
