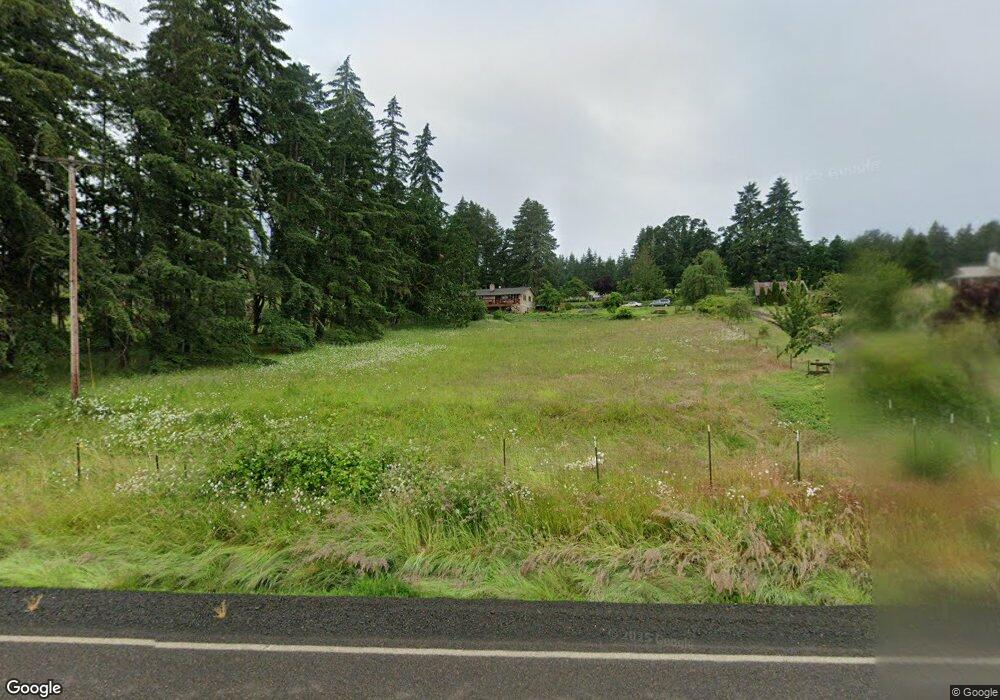
16120 Airlie Rd Monmouth, OR 97361
Estimated Value: $642,000 - $725,000
5
Beds
2
Baths
3,062
Sq Ft
$223/Sq Ft
Est. Value
About This Home
This home is located at 16120 Airlie Rd, Monmouth, OR 97361 and is currently estimated at $683,878, approximately $223 per square foot. 16120 Airlie Rd is a home located in Polk County with nearby schools including Oakdale Heights Elementary School, Whitworth Elementary School, and LaCreole Middle School.
Ownership History
Date
Name
Owned For
Owner Type
Purchase Details
Closed on
Jun 19, 2014
Sold by
Cushway Andrew R and Cushway Lisa M
Bought by
Cushway Andrew R and Cushway Lisa M
Current Estimated Value
Home Financials for this Owner
Home Financials are based on the most recent Mortgage that was taken out on this home.
Original Mortgage
$191,100
Outstanding Balance
$144,709
Interest Rate
4.16%
Mortgage Type
New Conventional
Estimated Equity
$539,169
Purchase Details
Closed on
Aug 29, 2013
Sold by
Hein Richard B and Hein Janice L
Bought by
Cushway Andrew R and Cushway Lisa M
Home Financials for this Owner
Home Financials are based on the most recent Mortgage that was taken out on this home.
Original Mortgage
$179,500
Interest Rate
4.33%
Mortgage Type
New Conventional
Create a Home Valuation Report for This Property
The Home Valuation Report is an in-depth analysis detailing your home's value as well as a comparison with similar homes in the area
Home Values in the Area
Average Home Value in this Area
Purchase History
| Date | Buyer | Sale Price | Title Company |
|---|---|---|---|
| Cushway Andrew R | -- | Amerititle | |
| Cushway Andrew R | $210,000 | Ticor Title |
Source: Public Records
Mortgage History
| Date | Status | Borrower | Loan Amount |
|---|---|---|---|
| Open | Cushway Andrew R | $191,100 | |
| Closed | Cushway Andrew R | $179,500 |
Source: Public Records
Tax History Compared to Growth
Tax History
| Year | Tax Paid | Tax Assessment Tax Assessment Total Assessment is a certain percentage of the fair market value that is determined by local assessors to be the total taxable value of land and additions on the property. | Land | Improvement |
|---|---|---|---|---|
| 2025 | $3,081 | $252,270 | $21,080 | $231,190 |
| 2024 | $3,081 | $245,049 | $20,589 | $224,460 |
| 2023 | $2,823 | $238,041 | $20,111 | $217,930 |
| 2022 | $2,752 | $231,234 | $19,644 | $211,590 |
| 2021 | $2,681 | $224,619 | $19,189 | $205,430 |
| 2020 | $2,610 | $218,206 | $18,756 | $199,450 |
| 2019 | $2,538 | $211,983 | $18,333 | $193,650 |
| 2018 | $2,456 | $205,932 | $17,922 | $188,010 |
| 2017 | $2,342 | $200,054 | $17,514 | $182,540 |
| 2016 | $2,370 | $194,346 | $17,116 | $177,230 |
| 2015 | $2,326 | $188,810 | $16,730 | $172,080 |
| 2014 | $2,234 | $183,435 | $16,355 | $167,080 |
Source: Public Records
Map
Nearby Homes
- 16000 Airlie Rd
- 0 (Next To) Airlie Rd
- 7465 Kings Valley Hwy
- 7340/7350 Smith Rd
- 7350 Smith Rd
- 0 Next To Airlie Rd Unit 220204700
- 0 Next To Airlie Rd Unit 830692
- 0 Westview Ln Unit 24100906
- 0 Westview Ln Unit 822683
- 14609 Forest Hill Dr
- 14906 Ferns Corner Rd
- 000 Kings Valley Hwy
- 13530 Fishback Rd
- 13100 Rd
- 18390 Bridgeport Rd
- 0 Airlie Rd
- 13260 Fishback Rd
- Lot 400/201 Falls City Rd
- 4340 S Kings Valley Hwy
- 14060 Simpson Rd
- 16090 Airlie Rd
- 16140 Airlie Rd
- 16080 Airlie Rd
- 16125 Airlie Rd
- 16085 Airlie Rd
- 16070 Airlie Rd
- 16095 Airlie Rd
- 16065 Airlie Rd
- 16060 Airlie Rd
- 16215 Airlie Rd
- 16300 Shady Lane Rd
- 16275 Shady Lane Rd
- 16325 Shady Lane Rd
- 16525 Shady Lane Rd
- 16340 Airlie Rd
- 0 Parcel 2 Airlie Rd
- 0 Parcel 1 Airlie Rd
- 16062 Airlie Rd
- 16390 Airlie Rd
- 16405 Airlie Rd