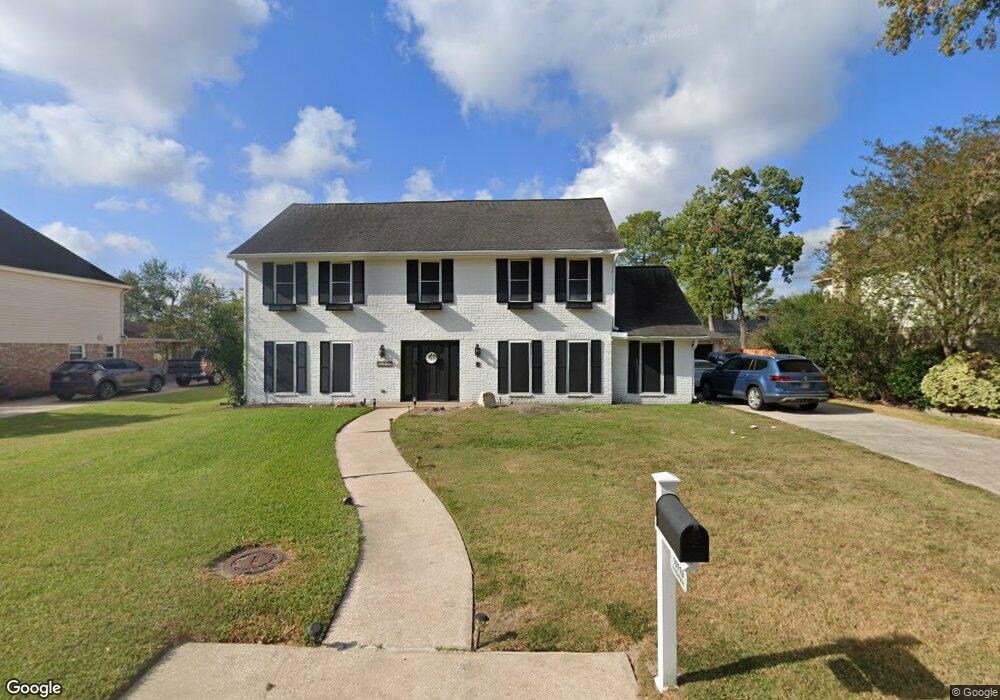
16120 Stuebner Airline Rd Unit 303 Spring, TX 77379
Champions NeighborhoodEstimated Value: $141,036 - $212,000
2
Beds
2
Baths
1,103
Sq Ft
$146/Sq Ft
Est. Value
About This Home
This home is located at 16120 Stuebner Airline Rd Unit 303, Spring, TX 77379 and is currently estimated at $160,509, approximately $145 per square foot. 16120 Stuebner Airline Rd Unit 303 is a home located in Harris County with nearby schools including Mittelstadt Elementary School, Kleb Intermediate School, and Klein High School.
Ownership History
Date
Name
Owned For
Owner Type
Purchase Details
Closed on
Nov 29, 2022
Sold by
Randio Tonya
Bought by
Nwanganga Chinyere and Nwanganga Oluchi
Current Estimated Value
Purchase Details
Closed on
Feb 27, 2017
Sold by
Thacker Nunez Shanna M
Bought by
Randio Tonya
Purchase Details
Closed on
Nov 27, 2007
Sold by
Marshall Vivian R
Bought by
Thacker Shanna M
Home Financials for this Owner
Home Financials are based on the most recent Mortgage that was taken out on this home.
Original Mortgage
$45,000
Interest Rate
6.26%
Mortgage Type
Purchase Money Mortgage
Purchase Details
Closed on
Jan 20, 2005
Sold by
Hultquist Bettie
Bought by
Marshall Vivian R
Purchase Details
Closed on
Oct 1, 1999
Sold by
Tugbang Ramon R
Bought by
Hultquist Bettie
Create a Home Valuation Report for This Property
The Home Valuation Report is an in-depth analysis detailing your home's value as well as a comparison with similar homes in the area
Home Values in the Area
Average Home Value in this Area
Purchase History
| Date | Buyer | Sale Price | Title Company |
|---|---|---|---|
| Nwanganga Chinyere | -- | First American Title | |
| Randio Tonya | -- | None Available | |
| Thacker Shanna M | -- | First American Title | |
| Marshall Vivian R | -- | Startex 07 Title Company | |
| Hultquist Bettie | -- | Alamo Title 40 |
Source: Public Records
Mortgage History
| Date | Status | Borrower | Loan Amount |
|---|---|---|---|
| Previous Owner | Thacker Shanna M | $45,000 |
Source: Public Records
Tax History Compared to Growth
Tax History
| Year | Tax Paid | Tax Assessment Tax Assessment Total Assessment is a certain percentage of the fair market value that is determined by local assessors to be the total taxable value of land and additions on the property. | Land | Improvement |
|---|---|---|---|---|
| 2025 | $3,112 | $154,517 | $29,358 | $125,159 |
| 2024 | $3,112 | $162,492 | $30,873 | $131,619 |
| 2023 | $3,112 | $154,366 | $29,330 | $125,036 |
| 2022 | $2,696 | $131,240 | $24,936 | $106,304 |
| 2021 | $2,225 | $101,702 | $19,323 | $82,379 |
| 2020 | $1,876 | $82,168 | $15,612 | $66,556 |
| 2019 | $1,035 | $43,611 | $8,286 | $35,325 |
| 2018 | $599 | $41,875 | $7,956 | $33,919 |
| 2017 | $1,541 | $79,010 | $15,012 | $63,998 |
| 2016 | $1,401 | $69,020 | $13,114 | $55,906 |
| 2015 | $96 | $54,377 | $10,332 | $44,045 |
| 2014 | $96 | $51,635 | $9,811 | $41,824 |
Source: Public Records
Map
Nearby Homes
- 16120 Stuebner Airline Rd Unit 608
- 16120 Stuebner Airline Rd Unit 601
- 6830 Jasmine Place St
- 16114 Castletown Park Ct
- 6803 Farnaby Ct
- 16002 Castletown Park Ct
- 16418 York Minster Dr
- 6706 Trebeck Ln
- 6610 Chancellor Dr
- 6658 Radley Dr
- 7623 Heathrow Ln
- 7602 Feliciana Ln
- 7707 Heathrow Ln
- 16615 Sir William Dr
- 15628 Latson St
- 16122 Wimbledon Forest Dr
- 15602 Cypress Garden Dr
- 6514 Fraser Point Ct
- 6510 Fraser Point Ct
- 6510 Hoads Deuce Ct
- 16120 Stuebner Airline Rd Unit 103
- 16120 Stuebner Airline Rd Unit 206
- 16120 Stuebner Airline Rd Unit 205
- 16120 Stuebner Airline Rd Unit 610
- 16120 Stuebner Airline Rd Unit 207
- 16120 Stuebner Airline Rd Unit 504
- 16120 Stuebner Airline Rd Unit 606
- 16120 Stuebner Airline Rd Unit 212
- 16120 Stuebner Airline Rd Unit 612
- 16120 Stuebner Airline Rd Unit 611
- 16120 Stuebner Airline Rd Unit 609
- 16120 Stuebner Airline Rd Unit 608
- 16120 Stuebner Airline Rd Unit 607
- 16120 Stuebner Airline Rd Unit 605
- 16120 Stuebner Airline Rd Unit 604
- 16120 Stuebner Airline Rd Unit 603
- 16120 Stuebner Airline Rd Unit 602
- 16120 Stuebner Airline Rd Unit 601
- 16120 Stuebner Airline Rd Unit 508
- 16120 Stuebner Airline Rd Unit 507