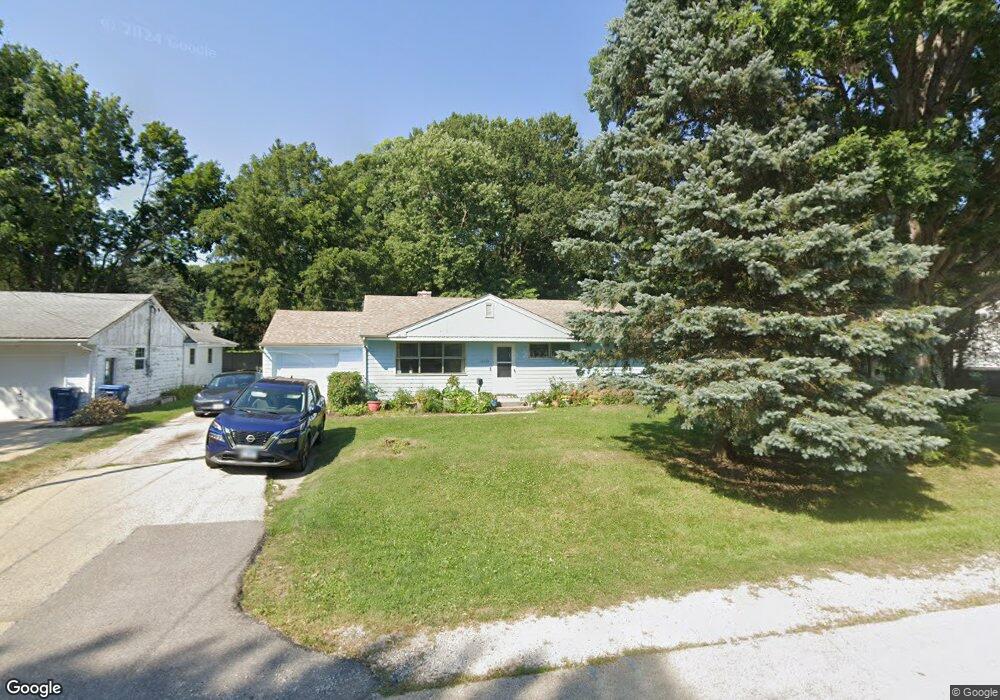
16120 W Arlington Dr Libertyville, IL 60048
Estimated Value: $284,251 - $372,000
--
Bed
1
Bath
1,080
Sq Ft
$305/Sq Ft
Est. Value
About This Home
This home is located at 16120 W Arlington Dr, Libertyville, IL 60048 and is currently estimated at $329,313, approximately $304 per square foot. 16120 W Arlington Dr is a home located in Lake County with nearby schools including Adler Park School, Highland Middle School, and Libertyville High School.
Ownership History
Date
Name
Owned For
Owner Type
Purchase Details
Closed on
Nov 3, 2014
Sold by
Ramirez David and Duran Martha B
Bought by
Citimortgage Inc
Current Estimated Value
Purchase Details
Closed on
Feb 16, 2005
Sold by
Ramirez David
Bought by
Duran Martha B
Purchase Details
Closed on
Jun 30, 1999
Sold by
Gill Hancel C
Bought by
Ramirez David and Duran Martha B
Home Financials for this Owner
Home Financials are based on the most recent Mortgage that was taken out on this home.
Original Mortgage
$134,100
Interest Rate
7.28%
Mortgage Type
FHA
Purchase Details
Closed on
Aug 18, 1995
Sold by
Gill Karen M
Bought by
Gill Hancel C
Home Financials for this Owner
Home Financials are based on the most recent Mortgage that was taken out on this home.
Original Mortgage
$81,600
Interest Rate
7.43%
Create a Home Valuation Report for This Property
The Home Valuation Report is an in-depth analysis detailing your home's value as well as a comparison with similar homes in the area
Home Values in the Area
Average Home Value in this Area
Purchase History
| Date | Buyer | Sale Price | Title Company |
|---|---|---|---|
| Citimortgage Inc | -- | None Available | |
| Duran Martha B | -- | -- | |
| Ramirez David | $135,000 | -- | |
| Gill Hancel C | -- | Imperial Land Title Inc |
Source: Public Records
Mortgage History
| Date | Status | Borrower | Loan Amount |
|---|---|---|---|
| Previous Owner | Ramirez David | $134,100 | |
| Previous Owner | Gill Hancel C | $81,600 |
Source: Public Records
Tax History Compared to Growth
Tax History
| Year | Tax Paid | Tax Assessment Tax Assessment Total Assessment is a certain percentage of the fair market value that is determined by local assessors to be the total taxable value of land and additions on the property. | Land | Improvement |
|---|---|---|---|---|
| 2024 | $5,539 | $80,274 | $28,424 | $51,850 |
| 2023 | $5,065 | $70,515 | $24,969 | $45,546 |
| 2022 | $5,065 | $65,030 | $23,999 | $41,031 |
| 2021 | $4,874 | $63,630 | $23,482 | $40,148 |
| 2020 | $4,467 | $59,581 | $21,988 | $37,593 |
| 2019 | $4,353 | $59,015 | $21,779 | $37,236 |
| 2018 | $4,179 | $58,523 | $26,038 | $32,485 |
| 2017 | $4,125 | $56,675 | $25,216 | $31,459 |
| 2016 | $3,992 | $53,735 | $23,908 | $29,827 |
| 2015 | $3,965 | $50,224 | $22,346 | $27,878 |
| 2014 | $3,411 | $47,190 | $20,996 | $26,194 |
| 2012 | $3,721 | $49,584 | $22,061 | $27,523 |
Source: Public Records
Map
Nearby Homes
- 16108 W Des Plaines Dr
- 16051 W Des Plaines Dr
- 15734 W Buckley Rd
- 31132-31140 N Milwaukee Ave
- 1211 Parliament Ct
- 15342 W Clover Ln
- 1935 Lynn Cir
- 922 N Milwaukee Ave Unit A
- 921 Guerin Rd
- 204 W Ellis Ave
- 208 W Ellis Ave
- 212 W Ellis Ave
- 616 Parkside Ct
- 224 Newberry Ave
- 619 Parkside Ct
- 662 Parkside Ct
- 694 Parkside Ct
- 15040 W Clover Ln
- 217 E Church St
- 178 Brookhill Rd
- 16130 W Arlington Dr
- 16100 W Arlington Dr
- 16142 W Arlington Dr
- 16101 W Arlington Dr
- 16127 W Arlington Dr
- 16152 W Arlington Dr
- 16086 W Arlington Dr
- 16139 W Arlington Dr
- 16075 W Arlington Dr
- 16151 W Arlington Dr
- 16072 W Arlington Dr
- 16160 W Arlington Dr
- 16115 W Buckley Rd
- 16088 W Des Plaines Dr
- 16139 W Buckley Rd
- 16085 W Buckley Rd
- 16056 W Arlington Dr
- 16124 W Des Plaines Dr
- 30445 N Center Ave
- 16180 W Arlington Dr