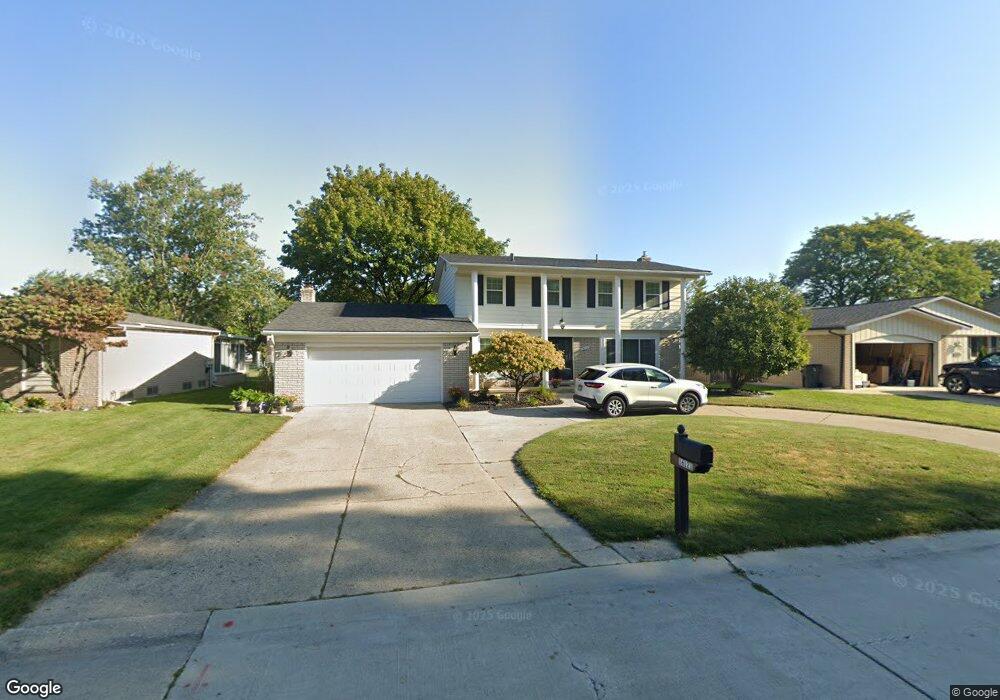
16121 Anstell Ct Clinton Township, MI 48038
Estimated Value: $327,297 - $375,000
--
Bed
2
Baths
2,212
Sq Ft
$162/Sq Ft
Est. Value
About This Home
This home is located at 16121 Anstell Ct, Clinton Township, MI 48038 and is currently estimated at $357,574, approximately $161 per square foot. 16121 Anstell Ct is a home located in Macomb County with nearby schools including Huron Elementary School, Wyandot Middle School, and Chippewa Valley High School.
Ownership History
Date
Name
Owned For
Owner Type
Purchase Details
Closed on
Nov 30, 2021
Sold by
Baich Osborn Melissa
Bought by
Baich Osborn Melissa and Osborn Ricky D
Current Estimated Value
Home Financials for this Owner
Home Financials are based on the most recent Mortgage that was taken out on this home.
Original Mortgage
$213,750
Outstanding Balance
$196,541
Interest Rate
3.09%
Mortgage Type
New Conventional
Estimated Equity
$161,033
Purchase Details
Closed on
Nov 3, 2021
Sold by
Jurkiewicz Melanie and The Trust Agreement Of Olga Ba
Bought by
Baich Osborn Melissa
Home Financials for this Owner
Home Financials are based on the most recent Mortgage that was taken out on this home.
Original Mortgage
$213,750
Outstanding Balance
$196,541
Interest Rate
3.09%
Mortgage Type
New Conventional
Estimated Equity
$161,033
Purchase Details
Closed on
Sep 21, 1998
Sold by
Baich Olga
Bought by
Baich Olga Trust
Create a Home Valuation Report for This Property
The Home Valuation Report is an in-depth analysis detailing your home's value as well as a comparison with similar homes in the area
Home Values in the Area
Average Home Value in this Area
Purchase History
| Date | Buyer | Sale Price | Title Company |
|---|---|---|---|
| Baich Osborn Melissa | -- | Reputation First Ttl Agcy Ll | |
| Baich Osborn Melissa | -- | Reputation First Ttl Agcy Ll | |
| Baich Olga Trust | -- | -- |
Source: Public Records
Mortgage History
| Date | Status | Borrower | Loan Amount |
|---|---|---|---|
| Open | Baich Osborn Melissa | $213,750 |
Source: Public Records
Tax History Compared to Growth
Tax History
| Year | Tax Paid | Tax Assessment Tax Assessment Total Assessment is a certain percentage of the fair market value that is determined by local assessors to be the total taxable value of land and additions on the property. | Land | Improvement |
|---|---|---|---|---|
| 2025 | $4,073 | $160,100 | $0 | $0 |
| 2024 | $2,427 | $148,400 | $0 | $0 |
| 2023 | $2,302 | $131,900 | $0 | $0 |
| 2022 | $3,690 | $121,200 | $0 | $0 |
| 2021 | $5,117 | $118,100 | $0 | $0 |
| 2020 | $2,112 | $115,700 | $0 | $0 |
| 2019 | $3,343 | $108,400 | $0 | $0 |
| 2018 | $3,274 | $98,600 | $0 | $0 |
| 2017 | $3,245 | $92,800 | $23,100 | $69,700 |
| 2016 | $3,224 | $92,800 | $0 | $0 |
| 2015 | -- | $90,200 | $0 | $0 |
| 2014 | -- | $85,100 | $0 | $0 |
| 2011 | -- | $75,900 | $19,800 | $56,100 |
Source: Public Records
Map
Nearby Homes
- 39043 Cadborough Dr
- 39519 Twenlow Dr
- 16611 Ventura Cir Unit 67
- 39237 Sunderland Dr
- 16513 Edinburgh Dr
- 39143 Baroque Blvd
- 39713 Chaffer Ct
- 15492 S Royal Doulton Blvd
- 38756 Cheldon St
- 38750 Garfield Rd
- 39348 Heatherheath Dr Unit 7
- 38082 Versailles St
- 39575 Old Dominion Dr
- 15730 Lorway Dr
- 16196 Notre Dame St
- 39551 Heatherheath Dr Unit 2
- 38683 Bayside Ct Unit 118
- 39563 Heatherheath Dr
- 38797 Windmill Pointe W
- 17008 Smugglers Cove St
- 16137 Anstell Ct
- 16105 Anstell Ct
- 16122 Raygaert Dr
- 16106 Raygaert Dr
- 16153 Anstell Ct
- 16138 Raygaert Dr
- 16116 Anstell Ct
- 16132 Anstell Ct
- 16100 Anstell Ct
- 16154 Raygaert Dr
- 39231 Cadborough Dr
- 39215 Cadborough Dr
- 39247 Cadborough Dr
- 16169 Anstell Ct
- 39318 Cadborough Dr
- 39191 Cadborough Dr
- 39176 Cadborough Dr
- 39263 Cadborough Dr
- 39319 Cobridge Dr
- 16170 Raygaert Dr