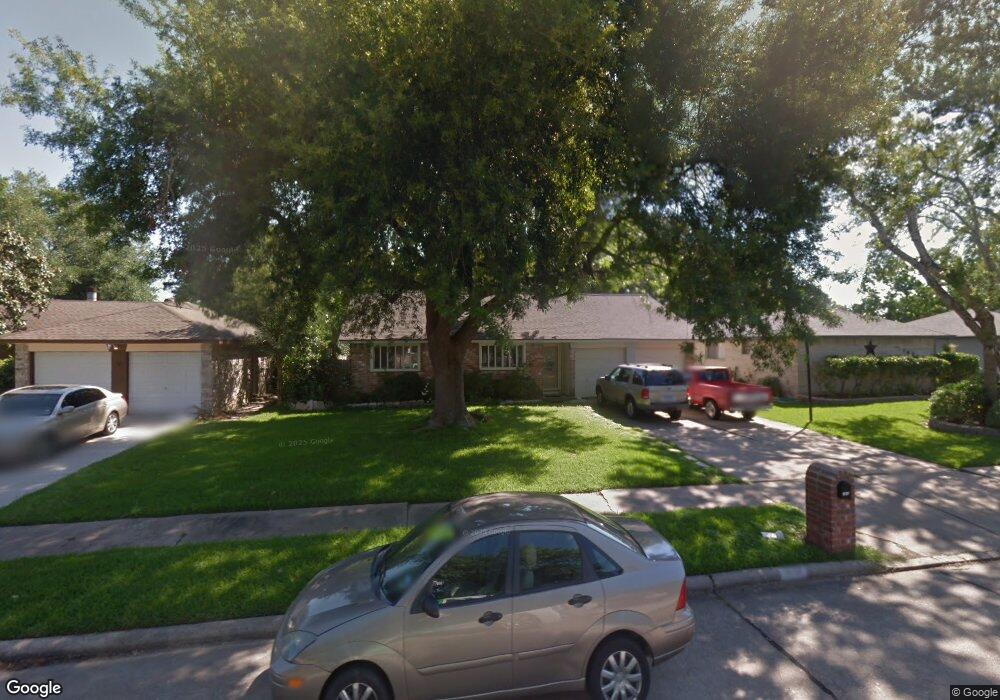
16127 Tibet Rd Friendswood, TX 77546
Estimated Value: $244,734 - $260,000
3
Beds
2
Baths
1,608
Sq Ft
$156/Sq Ft
Est. Value
About This Home
This home is located at 16127 Tibet Rd, Friendswood, TX 77546 and is currently estimated at $251,184, approximately $156 per square foot. 16127 Tibet Rd is a home located in Harris County with nearby schools including Wedgewood Elementary School, Brookside Intermediate School, and Clear Brook High School.
Ownership History
Date
Name
Owned For
Owner Type
Purchase Details
Closed on
Oct 29, 2021
Sold by
Gonzalez Jose L and Gonzalez Kimberly P
Bought by
Gonzalez Jose Luis and Gonzalez Kimberly Phillips
Current Estimated Value
Purchase Details
Closed on
Mar 27, 1995
Sold by
Redevelopment Specialists Of Texas Inc
Bought by
Gonzalez Jose L and Gonzalez Kimberly P
Home Financials for this Owner
Home Financials are based on the most recent Mortgage that was taken out on this home.
Original Mortgage
$63,150
Interest Rate
8.72%
Purchase Details
Closed on
May 31, 1994
Sold by
Taylor Alan Scott and Taylor Catherine L
Bought by
Redevelopment Specialists Of Texas Inc
Home Financials for this Owner
Home Financials are based on the most recent Mortgage that was taken out on this home.
Original Mortgage
$39,000
Interest Rate
8.19%
Mortgage Type
Seller Take Back
Create a Home Valuation Report for This Property
The Home Valuation Report is an in-depth analysis detailing your home's value as well as a comparison with similar homes in the area
Home Values in the Area
Average Home Value in this Area
Purchase History
| Date | Buyer | Sale Price | Title Company |
|---|---|---|---|
| Gonzalez Jose Luis | -- | None Available | |
| Gonzalez Jose L | -- | First American Title | |
| Redevelopment Specialists Of Texas Inc | -- | Houston Title Company |
Source: Public Records
Mortgage History
| Date | Status | Borrower | Loan Amount |
|---|---|---|---|
| Closed | Gonzalez Jose L | $63,150 | |
| Previous Owner | Redevelopment Specialists Of Texas Inc | $39,000 |
Source: Public Records
Tax History Compared to Growth
Tax History
| Year | Tax Paid | Tax Assessment Tax Assessment Total Assessment is a certain percentage of the fair market value that is determined by local assessors to be the total taxable value of land and additions on the property. | Land | Improvement |
|---|---|---|---|---|
| 2025 | $3,397 | $237,674 | $62,618 | $175,056 |
| 2024 | $3,397 | $248,364 | $62,618 | $185,746 |
| 2023 | $3,397 | $248,364 | $62,618 | $185,746 |
| 2022 | $4,240 | $214,341 | $62,618 | $151,723 |
| 2021 | $4,064 | $183,550 | $41,745 | $141,805 |
| 2020 | $4,013 | $163,940 | $40,006 | $123,934 |
| 2019 | $3,985 | $160,360 | $40,006 | $120,354 |
| 2018 | $717 | $151,998 | $31,309 | $120,689 |
| 2017 | $3,311 | $151,998 | $31,309 | $120,689 |
| 2016 | $3,010 | $138,550 | $31,309 | $107,241 |
| 2015 | $2,016 | $119,368 | $31,309 | $88,059 |
| 2014 | $2,016 | $108,414 | $24,351 | $84,063 |
Source: Public Records
Map
Nearby Homes
- 16114 Forest Bend Ave
- 5202 Apple Blossom Ln
- 16222 Forest Bend Ave
- 5131 Shady Oaks Ln
- 16050 Cedar Gully Dr
- 16327 Blackhawk Blvd
- 16303 Townes Rd
- 15818 Wandering Trail
- 5323 Abercreek Ave
- 16406 Blackhawk Blvd
- 5343 Royal Pkwy
- 5339 Appleblossom Ln
- Lots 29 and 42 Block Wedgewood Village Dr
- 5402 Royal Pkwy
- 4902 Quiet Canyon Dr
- 16510 Blackhawk Blvd
- 15719 Bougainvilla Ln
- 4930 Heritage Plains Dr
- 16607 David Glen Dr
- 4918 Heritage Plains Dr
- 16203 Tibet Rd
- 16123 Tibet Rd
- 16130 Barcelona Dr
- 16126 Barcelona Dr
- 16207 Tibet Rd
- 16119 Tibet Rd
- 16202 Barcelona Dr
- 16122 Barcelona Dr
- 16202 Tibet Rd
- 16126 Tibet Rd
- 16206 Barcelona Dr
- 16211 Tibet Rd
- 16115 Tibet Rd
- 16122 Tibet Rd
- 16118 Barcelona Dr
- 16210 Tibet Rd
- 16210 Barcelona Dr
- 16118 Tibet Rd
- 16215 Tibet Rd
- 16111 Tibet Rd