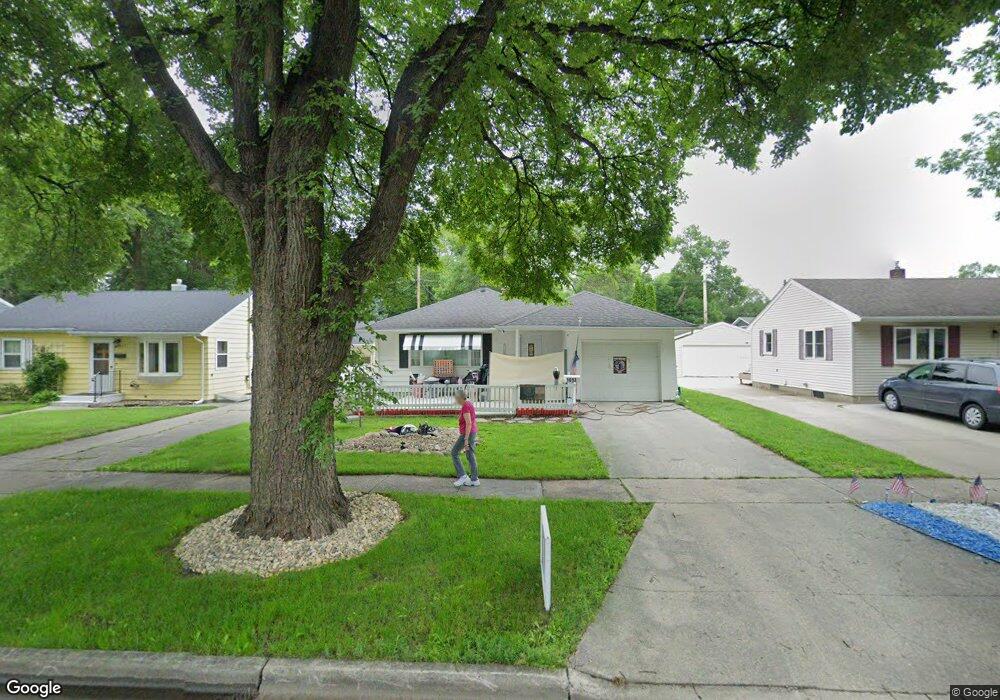
1613 4th St N Fargo, ND 58102
Washington NeighborhoodEstimated Value: $219,531 - $253,000
3
Beds
1
Bath
1,206
Sq Ft
$196/Sq Ft
Est. Value
About This Home
This home is located at 1613 4th St N, Fargo, ND 58102 and is currently estimated at $235,883, approximately $195 per square foot. 1613 4th St N is a home located in Cass County with nearby schools including Washington Elementary School, Ben Franklin Middle School, and North High School.
Ownership History
Date
Name
Owned For
Owner Type
Purchase Details
Closed on
Oct 24, 2017
Sold by
Olson Wanda
Bought by
Dentsch Corey D
Current Estimated Value
Home Financials for this Owner
Home Financials are based on the most recent Mortgage that was taken out on this home.
Original Mortgage
$168,000
Outstanding Balance
$140,365
Interest Rate
3.83%
Mortgage Type
VA
Estimated Equity
$95,518
Purchase Details
Closed on
Apr 20, 2010
Sold by
Roper Christine A
Bought by
Wirtzfeld Jacob T
Create a Home Valuation Report for This Property
The Home Valuation Report is an in-depth analysis detailing your home's value as well as a comparison with similar homes in the area
Home Values in the Area
Average Home Value in this Area
Purchase History
| Date | Buyer | Sale Price | Title Company |
|---|---|---|---|
| Dentsch Corey D | $168,000 | Title Co | |
| Wirtzfeld Jacob T | -- | -- |
Source: Public Records
Mortgage History
| Date | Status | Borrower | Loan Amount |
|---|---|---|---|
| Open | Dentsch Corey D | $168,000 |
Source: Public Records
Tax History
| Year | Tax Paid | Tax Assessment Tax Assessment Total Assessment is a certain percentage of the fair market value that is determined by local assessors to be the total taxable value of land and additions on the property. | Land | Improvement |
|---|---|---|---|---|
| 2024 | $367 | $102,500 | $20,050 | $82,450 |
| 2023 | $522 | $95,800 | $20,050 | $75,750 |
| 2022 | $473 | $93,900 | $20,050 | $73,850 |
| 2021 | $367 | $88,600 | $20,050 | $68,550 |
| 2020 | $614 | $84,400 | $20,050 | $64,350 |
| 2019 | $615 | $84,400 | $11,900 | $72,500 |
| 2018 | $571 | $84,500 | $11,900 | $72,600 |
| 2017 | $2,032 | $78,950 | $11,900 | $67,050 |
| 2016 | $2,015 | $71,750 | $11,900 | $59,850 |
| 2015 | $2,128 | $71,750 | $8,150 | $63,600 |
| 2014 | $2,058 | $67,250 | $8,150 | $59,100 |
| 2013 | $1,977 | $64,050 | $8,150 | $55,900 |
Source: Public Records
Map
Nearby Homes
- 1647 Broadway N
- 3216 Broadway N
- 1630 7th St N
- 1441 Broadway N Unit 203
- 1830 4th St N
- 1437 Broadway N Unit 101
- 77 18th Ave N
- 1345 4th St N
- 801 17th Ave N
- 1613 10th St N
- 301 21st Ave N
- 2001 8th St N
- 1625 11th St N
- 1257 4th St N
- 1626 11th St N
- 1249 2nd St N
- 1306 Elm St N
- 1329 10th St N
- 1245 1st St N
- 1451 12th St N
Your Personal Tour Guide
Ask me questions while you tour the home.