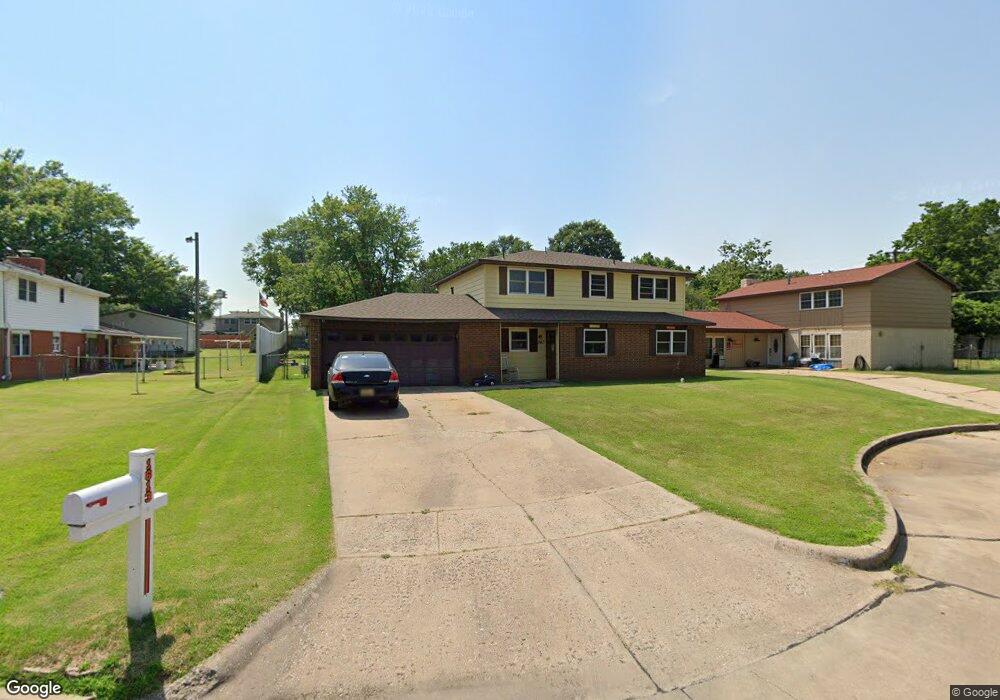
1613 Dean Ave Ponca City, OK 74604
Estimated Value: $177,377 - $210,000
4
Beds
3
Baths
1,864
Sq Ft
$101/Sq Ft
Est. Value
About This Home
This home is located at 1613 Dean Ave, Ponca City, OK 74604 and is currently estimated at $188,844, approximately $101 per square foot. 1613 Dean Ave is a home located in Kay County with nearby schools including E.M. Trout Elementary School, Ponca City East Middle School, and Ponca City West Middle School.
Ownership History
Date
Name
Owned For
Owner Type
Purchase Details
Closed on
Aug 11, 2022
Sold by
Jensen Family Trust
Bought by
Bryant Tina and Bryant John
Current Estimated Value
Purchase Details
Closed on
Aug 26, 2020
Sold by
Secretary Of Housing & Urban Development
Bought by
Bryant Tian
Home Financials for this Owner
Home Financials are based on the most recent Mortgage that was taken out on this home.
Original Mortgage
$78,551
Interest Rate
2.9%
Mortgage Type
FHA
Purchase Details
Closed on
Sep 5, 2019
Sold by
Us Bank National Association
Bought by
Secretary Of Housing & Urban Development
Purchase Details
Closed on
Aug 13, 2019
Sold by
Streeter Jonathan and Streeter Jonathan K
Bought by
Us Bank National Association
Purchase Details
Closed on
Nov 10, 2014
Sold by
Sloan Donald L and Sloan Mary D
Bought by
Streeter Jonathan K
Create a Home Valuation Report for This Property
The Home Valuation Report is an in-depth analysis detailing your home's value as well as a comparison with similar homes in the area
Home Values in the Area
Average Home Value in this Area
Purchase History
| Date | Buyer | Sale Price | Title Company |
|---|---|---|---|
| Bryant Tina | -- | -- | |
| Bryant Tian | -- | None Available | |
| Secretary Of Housing & Urban Development | -- | Servicelink | |
| Us Bank National Association | $80,247 | None Available | |
| Streeter Jonathan K | $105,000 | -- |
Source: Public Records
Mortgage History
| Date | Status | Borrower | Loan Amount |
|---|---|---|---|
| Previous Owner | Bryant Tian | $78,551 |
Source: Public Records
Tax History Compared to Growth
Tax History
| Year | Tax Paid | Tax Assessment Tax Assessment Total Assessment is a certain percentage of the fair market value that is determined by local assessors to be the total taxable value of land and additions on the property. | Land | Improvement |
|---|---|---|---|---|
| 2024 | $994 | $10,497 | $928 | $9,569 |
| 2023 | $994 | $9,997 | $928 | $9,069 |
| 2022 | $906 | $9,521 | $928 | $8,593 |
| 2021 | $911 | $9,521 | $928 | $8,593 |
| 2020 | $901 | $9,521 | $928 | $8,593 |
| 2019 | $882 | $9,235 | $928 | $8,307 |
| 2018 | $883 | $9,116 | $928 | $8,188 |
| 2017 | $913 | $9,311 | $928 | $8,383 |
| 2016 | $922 | $9,311 | $928 | $8,383 |
| 2015 | $911 | $9,155 | $928 | $8,227 |
| 2014 | $871 | $8,925 | $928 | $7,997 |
Source: Public Records
Map
Nearby Homes
- 1704 Fairway Place
- 3602 N 14th
- 3205 Kingston Rd
- 1413 Crawford Ave
- 3019 Meadow Ln
- 3013 Kingston Rd
- 2200 Chapel Hill Rd
- 2612 Meadow Ln
- 2602 Ridgecrest
- TBD 5th and Windsor
- 2211 Turner St
- 2216 El Camino St
- 2208 El Camino St
- 2205 Cardinal Rd
- 3651 N 14th St
- 2607 Bluestem Rd
- 7525 E Prospect Ave
- 211 E Prospect Ave
- 1150 E Prospect Ave
- 1916 Meadowbrook St