Estimated Value: $825,000 - $1,087,000
5
Beds
4
Baths
3,233
Sq Ft
$305/Sq Ft
Est. Value
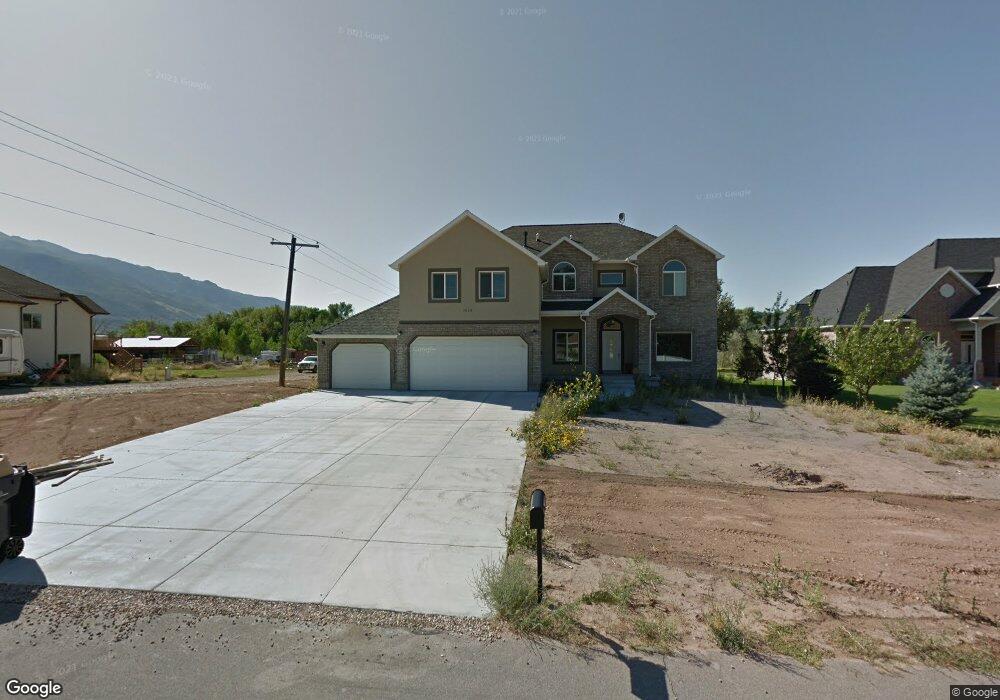
About This Home
This home is located at 1613 E 6850 S, Ogden, UT 84405 and is currently estimated at $985,236, approximately $304 per square foot. 1613 E 6850 S is a home located in Weber County with nearby schools including H Guy Child School, South Ogden Junior High School, and Bonneville High School.
Ownership History
Date
Name
Owned For
Owner Type
Purchase Details
Closed on
Apr 10, 2009
Sold by
Lucas Jared A
Bought by
Falslev Josh M and Falslev Laurie
Current Estimated Value
Purchase Details
Closed on
Apr 7, 2009
Sold by
Lucas Jared A
Bought by
Falslev Josh M and Falslev Laurie
Purchase Details
Closed on
Aug 13, 2002
Sold by
Ed Higley Llc
Bought by
Ed Green Construction Inc
Home Financials for this Owner
Home Financials are based on the most recent Mortgage that was taken out on this home.
Original Mortgage
$51,561
Interest Rate
6.52%
Purchase Details
Closed on
Aug 5, 2002
Sold by
Ed Green Construction Inc and Green Edward
Bought by
Lucas Jared A
Home Financials for this Owner
Home Financials are based on the most recent Mortgage that was taken out on this home.
Original Mortgage
$51,561
Interest Rate
6.52%
Create a Home Valuation Report for This Property
The Home Valuation Report is an in-depth analysis detailing your home's value as well as a comparison with similar homes in the area
Home Values in the Area
Average Home Value in this Area
Purchase History
| Date | Buyer | Sale Price | Title Company |
|---|---|---|---|
| Falslev Josh M | -- | First American Layton | |
| Lucas Jared A | -- | First American Layton | |
| Falslev Josh M | -- | First American Layton | |
| Ed Green Construction Inc | -- | -- | |
| Lucas Jared A | -- | -- |
Source: Public Records
Mortgage History
| Date | Status | Borrower | Loan Amount |
|---|---|---|---|
| Previous Owner | Lucas Jared A | $51,561 |
Source: Public Records
Tax History
| Year | Tax Paid | Tax Assessment Tax Assessment Total Assessment is a certain percentage of the fair market value that is determined by local assessors to be the total taxable value of land and additions on the property. | Land | Improvement |
|---|---|---|---|---|
| 2025 | $4,983 | $910,972 | $231,617 | $679,355 |
| 2024 | $4,657 | $492,627 | $127,389 | $365,238 |
| 2023 | $4,107 | $488,950 | $126,520 | $362,430 |
| 2022 | $4,167 | $443,300 | $112,565 | $330,735 |
| 2021 | $3,160 | $630,000 | $128,958 | $501,042 |
| 2020 | $2,819 | $518,000 | $102,907 | $415,093 |
| 2019 | $2,888 | $502,000 | $77,702 | $424,298 |
| 2018 | $2,777 | $462,000 | $77,702 | $384,298 |
| 2017 | $2,697 | $428,000 | $77,702 | $350,298 |
| 2016 | $2,488 | $215,075 | $37,032 | $178,043 |
| 2015 | $2,342 | $198,405 | $37,032 | $161,373 |
| 2014 | $1,148 | $96,392 | $37,032 | $59,360 |
Source: Public Records
Map
Nearby Homes
- 1593 E 6600 S
- 1458 E South Weber Dr
- 1577 E South Weber Dr Unit 3
- 7212 S Harolds Way
- 1873 E 7600 S
- 7484 S 1160 E Unit 1
- 1042 E Lester Dr
- 1411 E 6175 S
- 6208 S 1350 E
- 6171 S 1525 E
- 1119 E South Bench Dr Unit 9
- 7478 1980 E
- 6167 S 1275 E
- 1241 E 6125 S
- 1995 E 6225 S
- 975 E 6600 S Unit 62
- 975 E 6600 S Unit 55
- 2237 E Parkside Cir
- 1425 E 5850 S Unit 4E
- 1425 E 5850 S Unit 3D
- 1617 E 6850 S
- 1617 E 6850 S Unit 1
- 1609 E 6850 S
- 1614 E 6850 S Unit 3
- 1614 E 6850 S
- 6854 S 1600 E
- 1593 E 6850 S Unit 4
- 1593 E 6850 S
- 1625 E 6850 S
- 1625 E 6850 S Unit 2
- 6836 S 1600 E
- 1577 E 6850 S
- 6855 S 1600 E
- 1631 E 6850 S
- 1631 E 6850 S Unit 3
- 1644 6850 S Unit 7
- 6839 S 1600 E
- 1641 E 6800 S
- 1565 E 6850 S
- 6818 S 1600 E
Your Personal Tour Guide
Ask me questions while you tour the home.