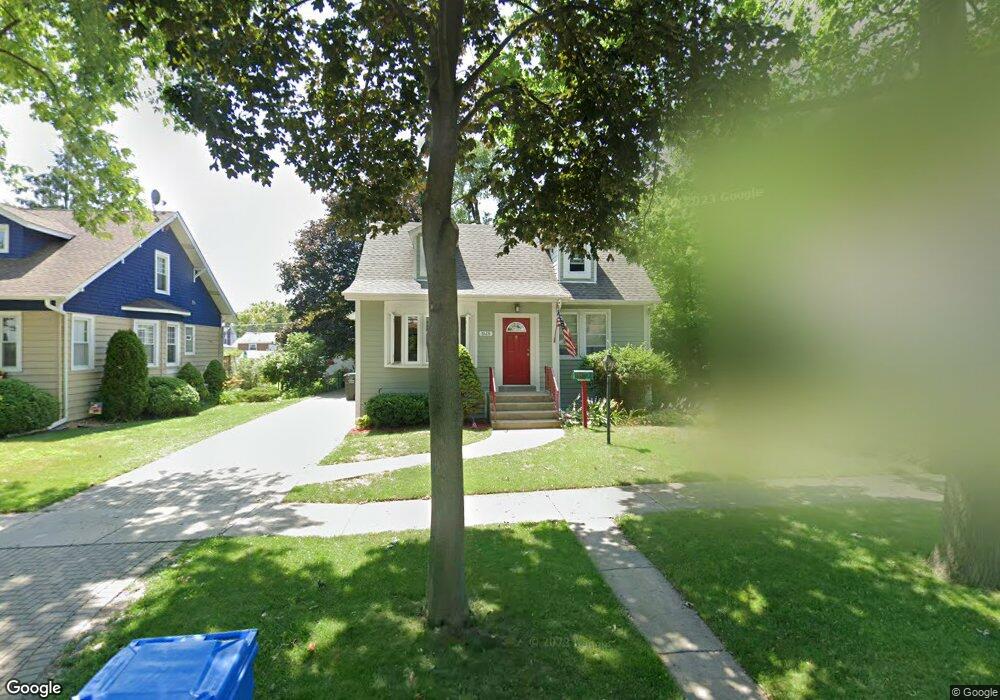
1613 E Walnut Ave Des Plaines, IL 60016
Estimated Value: $477,164 - $585,000
3
Beds
2
Baths
2,455
Sq Ft
$211/Sq Ft
Est. Value
About This Home
This home is located at 1613 E Walnut Ave, Des Plaines, IL 60016 and is currently estimated at $519,041, approximately $211 per square foot. 1613 E Walnut Ave is a home located in Cook County with nearby schools including Central Elementary School, Chippewa Middle School, and Maine West High School.
Ownership History
Date
Name
Owned For
Owner Type
Purchase Details
Closed on
May 3, 2024
Sold by
Ross Richard R and Ross Kathryn R
Bought by
Ross Family Trust and Ross
Current Estimated Value
Purchase Details
Closed on
Mar 12, 2007
Sold by
Jones Kathryn and Hepburn Kathryn
Bought by
Ross Richard R and Ross Kathryn
Home Financials for this Owner
Home Financials are based on the most recent Mortgage that was taken out on this home.
Original Mortgage
$252,500
Interest Rate
7.5%
Mortgage Type
Unknown
Purchase Details
Closed on
Sep 26, 1998
Sold by
Hepburn David A
Bought by
Jones Kathryn and Hepburn Kathryn
Create a Home Valuation Report for This Property
The Home Valuation Report is an in-depth analysis detailing your home's value as well as a comparison with similar homes in the area
Home Values in the Area
Average Home Value in this Area
Purchase History
| Date | Buyer | Sale Price | Title Company |
|---|---|---|---|
| Ross Family Trust | -- | None Listed On Document | |
| Ross Richard R | -- | Residential Title Services | |
| Jones Kathryn | -- | -- |
Source: Public Records
Mortgage History
| Date | Status | Borrower | Loan Amount |
|---|---|---|---|
| Previous Owner | Ross Richard R | $252,500 |
Source: Public Records
Tax History
| Year | Tax Paid | Tax Assessment Tax Assessment Total Assessment is a certain percentage of the fair market value that is determined by local assessors to be the total taxable value of land and additions on the property. | Land | Improvement |
|---|---|---|---|---|
| 2025 | $8,617 | $48,000 | $6,750 | $41,250 |
| 2024 | $8,617 | $36,000 | $6,000 | $30,000 |
| 2023 | $8,383 | $36,000 | $6,000 | $30,000 |
| 2022 | $8,383 | $36,000 | $6,000 | $30,000 |
| 2021 | $7,284 | $27,028 | $4,875 | $22,153 |
| 2020 | $7,230 | $27,028 | $4,875 | $22,153 |
| 2019 | $7,159 | $30,032 | $4,875 | $25,157 |
| 2018 | $8,778 | $32,788 | $4,312 | $28,476 |
| 2017 | $8,641 | $32,788 | $4,312 | $28,476 |
| 2016 | $8,417 | $32,788 | $4,312 | $28,476 |
| 2015 | $7,277 | $26,693 | $3,750 | $22,943 |
| 2014 | $7,139 | $26,693 | $3,750 | $22,943 |
| 2013 | $6,944 | $26,693 | $3,750 | $22,943 |
Source: Public Records
Map
Nearby Homes
- 1630 Henry Ave
- 1638 Oakwood Ave
- 1524 Oakwood Ave
- 1649 Ashland Ave Unit 501
- 1600 E Thacker St Unit 513
- 905 Center St Unit B208
- 1380 Oakwood Ave Unit 306
- 900 Center St Unit 3A
- 770 Pearson St Unit 808
- 1700 E Forest Ave
- 750 Pearson St Unit 904
- 821 Lexington Cir E
- 711 S River Rd Unit 617
- 711 S River Rd Unit 704
- 650 S River Rd Unit 812
- 1685 Mill St Unit 409
- 1277 E Thacker St Unit 303
- 787 Graceland Ave Unit 202B
- 1990 Berry Ln
- 1048 E Walnut Ave
- 1623 E Walnut Ave
- 1603 E Walnut Ave
- 1631 E Walnut Ave
- 1595 E Walnut Ave
- 1639 E Walnut Ave
- 1616 Henry Ave
- 1606 Henry Ave
- 1606 Henry Ave
- 1630 Henry Ave
- 1630 Henry Ave
- 1645 E Walnut Ave
- 1640 Henry Ave
- 1640 Henry Ave
- 1614 E Walnut Ave
- 1589 E Walnut Ave
- 1596 Henry Ave
- 1630 E Walnut Ave
- 1653 E Walnut Ave
- 1638 E Walnut Ave
- 1579 E Walnut Ave
Your Personal Tour Guide
Ask me questions while you tour the home.