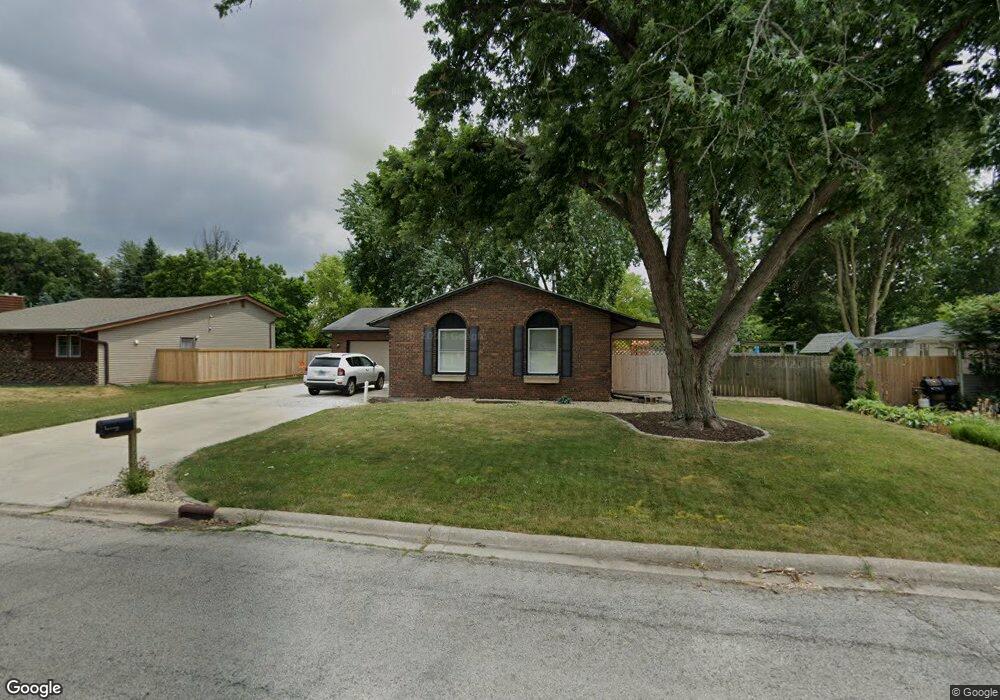
1613 Erin Dr Normal, IL 61761
Kingsridge NeighborhoodEstimated Value: $239,756 - $255,000
3
Beds
2
Baths
1,222
Sq Ft
$201/Sq Ft
Est. Value
About This Home
This home is located at 1613 Erin Dr, Normal, IL 61761 and is currently estimated at $245,939, approximately $201 per square foot. 1613 Erin Dr is a home located in McLean County with nearby schools including Oakdale Elementary School, Kingsley Junior High School, and Normal Community West High School.
Ownership History
Date
Name
Owned For
Owner Type
Purchase Details
Closed on
Jun 9, 2025
Sold by
Aubin Kaitlin W and Aubin Chad S
Bought by
Lind Carol A and Lind Edwin D
Current Estimated Value
Purchase Details
Closed on
Jun 18, 2020
Sold by
Tuley Joshua Thomas
Bought by
Aubin Chad S and Aubin Kaitlin W
Home Financials for this Owner
Home Financials are based on the most recent Mortgage that was taken out on this home.
Original Mortgage
$148,675
Interest Rate
3.2%
Mortgage Type
New Conventional
Purchase Details
Closed on
Apr 28, 2007
Sold by
Buescher Waldo H and Buescher Mary Alice
Bought by
Tuley Joshua Thomas
Home Financials for this Owner
Home Financials are based on the most recent Mortgage that was taken out on this home.
Original Mortgage
$135,091
Interest Rate
6.21%
Create a Home Valuation Report for This Property
The Home Valuation Report is an in-depth analysis detailing your home's value as well as a comparison with similar homes in the area
Home Values in the Area
Average Home Value in this Area
Purchase History
| Date | Buyer | Sale Price | Title Company |
|---|---|---|---|
| Lind Carol A | $242,000 | Mclean County Title | |
| Aubin Chad S | $156,500 | Alliance Land Title | |
| Tuley Joshua Thomas | $137,000 | None Available |
Source: Public Records
Mortgage History
| Date | Status | Borrower | Loan Amount |
|---|---|---|---|
| Previous Owner | Aubin Chad S | $148,675 | |
| Previous Owner | Tuley Joshua Thomas | $135,091 |
Source: Public Records
Tax History
| Year | Tax Paid | Tax Assessment Tax Assessment Total Assessment is a certain percentage of the fair market value that is determined by local assessors to be the total taxable value of land and additions on the property. | Land | Improvement |
|---|---|---|---|---|
| 2024 | $4,604 | $70,769 | $15,124 | $55,645 |
| 2022 | $4,604 | $57,247 | $12,234 | $45,013 |
| 2021 | $4,415 | $54,012 | $11,543 | $42,469 |
| 2020 | $3,740 | $51,475 | $11,001 | $40,474 |
| 2019 | $3,609 | $51,199 | $10,942 | $40,257 |
| 2018 | $3,558 | $50,657 | $10,826 | $39,831 |
| 2017 | $3,431 | $50,657 | $10,826 | $39,831 |
| 2016 | $3,394 | $50,657 | $10,826 | $39,831 |
| 2015 | $3,280 | $49,469 | $10,572 | $38,897 |
| 2014 | $3,239 | $49,469 | $10,572 | $38,897 |
| 2013 | -- | $49,469 | $10,572 | $38,897 |
Source: Public Records
Map
Nearby Homes
- 1607 Hovey Ave
- 813 Highpoint Rd
- 1615 Fairfield Dr
- 112 S Cottage Ave
- 102 Nottingham Chase
- 2112 Parker Ave
- 1305 Kingsridge Ct Unit C
- 1015 Primrose Ln
- 301 Oakdale Ave
- 112 College Park Ct
- 67 Oak Park Rd
- 9 Parkshores Dr
- 1108 Hovey Ave
- 103 Cheltenham Dr
- 200 Felmley Dr
- 816 W College Ave
- Lot 8 Emeline St
- 203 Edwards Dr
- 39 Oak Park Rd
- 1507 Ensign Dr
- 1611 Erin Dr
- 1615 Erin Dr
- 1609 Erin Dr
- 1617 Erin Dr
- 220 Concord Dr
- 1619 Erin Dr
- 219 Concord Dr
- 218 Concord Dr
- 1607 Erin Dr
- 221 Foster Dr
- 218 Arlington Dr
- 219 Foster Dr
- 217 Concord Dr
- 216 Concord Dr
- 1621 Erin Dr
- 711 S Cottage Ave
- 711 S Cottage Ave
- 711 S Cottage Ave
- 711 S Cottage Ave
- 711 S Cottage Ave
Your Personal Tour Guide
Ask me questions while you tour the home.