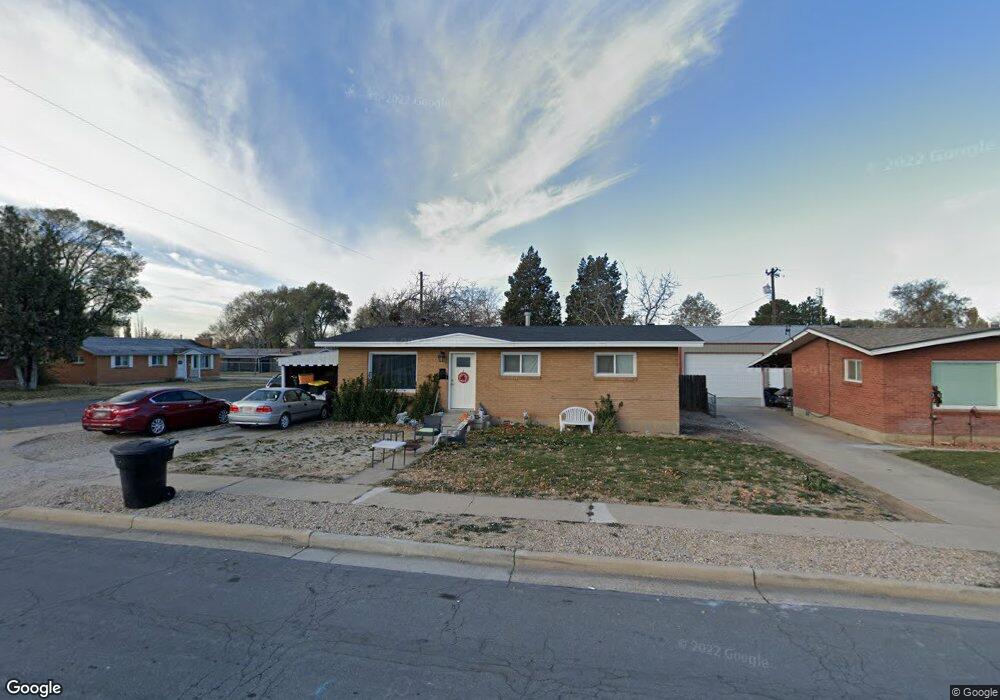
1613 N 350 W Clearfield, UT 84015
Estimated Value: $340,000 - $371,000
3
Beds
1
Bath
1,122
Sq Ft
$319/Sq Ft
Est. Value
About This Home
This home is located at 1613 N 350 W, Clearfield, UT 84015 and is currently estimated at $358,082, approximately $319 per square foot. 1613 N 350 W is a home located in Davis County with nearby schools including Sunset School, Sunset Junior High School, and Northridge High School.
Ownership History
Date
Name
Owned For
Owner Type
Purchase Details
Closed on
Nov 27, 2020
Sold by
Arnr Holdings Llc
Bought by
Gorman Jeremy
Current Estimated Value
Home Financials for this Owner
Home Financials are based on the most recent Mortgage that was taken out on this home.
Original Mortgage
$242,526
Outstanding Balance
$215,814
Interest Rate
2.8%
Mortgage Type
FHA
Estimated Equity
$142,268
Purchase Details
Closed on
Jun 23, 2020
Sold by
Rajigah Alice
Bought by
Arnr Holdings Llc
Purchase Details
Closed on
Mar 11, 2003
Sold by
Rajigah Brian B
Bought by
Rajigah Leslie and Rajigah Alice
Home Financials for this Owner
Home Financials are based on the most recent Mortgage that was taken out on this home.
Original Mortgage
$68,000
Interest Rate
5.22%
Create a Home Valuation Report for This Property
The Home Valuation Report is an in-depth analysis detailing your home's value as well as a comparison with similar homes in the area
Home Values in the Area
Average Home Value in this Area
Purchase History
| Date | Buyer | Sale Price | Title Company |
|---|---|---|---|
| Gorman Jeremy | -- | Title Guarantee | |
| Arnr Holdings Llc | -- | Vanguard Title Ins | |
| Rajigah Leslie | -- | First American Title Co |
Source: Public Records
Mortgage History
| Date | Status | Borrower | Loan Amount |
|---|---|---|---|
| Open | Gorman Jeremy | $242,526 | |
| Previous Owner | Rajigah Leslie | $68,000 |
Source: Public Records
Tax History Compared to Growth
Tax History
| Year | Tax Paid | Tax Assessment Tax Assessment Total Assessment is a certain percentage of the fair market value that is determined by local assessors to be the total taxable value of land and additions on the property. | Land | Improvement |
|---|---|---|---|---|
| 2025 | $1,791 | $163,350 | $69,241 | $94,109 |
| 2024 | $1,736 | $158,400 | $66,193 | $92,207 |
| 2023 | $1,617 | $269,000 | $105,875 | $163,125 |
| 2022 | $1,729 | $155,650 | $60,681 | $94,969 |
| 2021 | $1,534 | $217,000 | $64,661 | $152,339 |
| 2020 | $1,236 | $172,000 | $54,424 | $117,576 |
| 2019 | $1,163 | $166,000 | $70,316 | $95,684 |
| 2018 | $1,031 | $144,000 | $56,193 | $87,807 |
| 2016 | $880 | $63,195 | $26,565 | $36,630 |
| 2015 | $852 | $57,255 | $26,565 | $30,690 |
| 2014 | $801 | $55,644 | $26,565 | $29,079 |
| 2013 | -- | $59,252 | $23,265 | $35,987 |
Source: Public Records
Map
Nearby Homes
- 1623 N 400 W
- 1696 N 475 W
- 1721 N 400 W
- 36 W 1600 N
- 1534 N 300 W
- 1746 N 475 W
- 312 W 1425 N
- 1438 N 475 W
- 1443 N 200 W
- 1378 N 300 W
- 1874 N 200 W
- 31 W 1600 N
- 1647 N Main St
- 1974 N 75 W
- 52 W 2000 N
- 1214 N 700 W
- 2085 N Main St Unit 409
- 2085 N Main St Unit 108
- 2085 N Main St Unit 401
- 2085 N Main St Unit 308