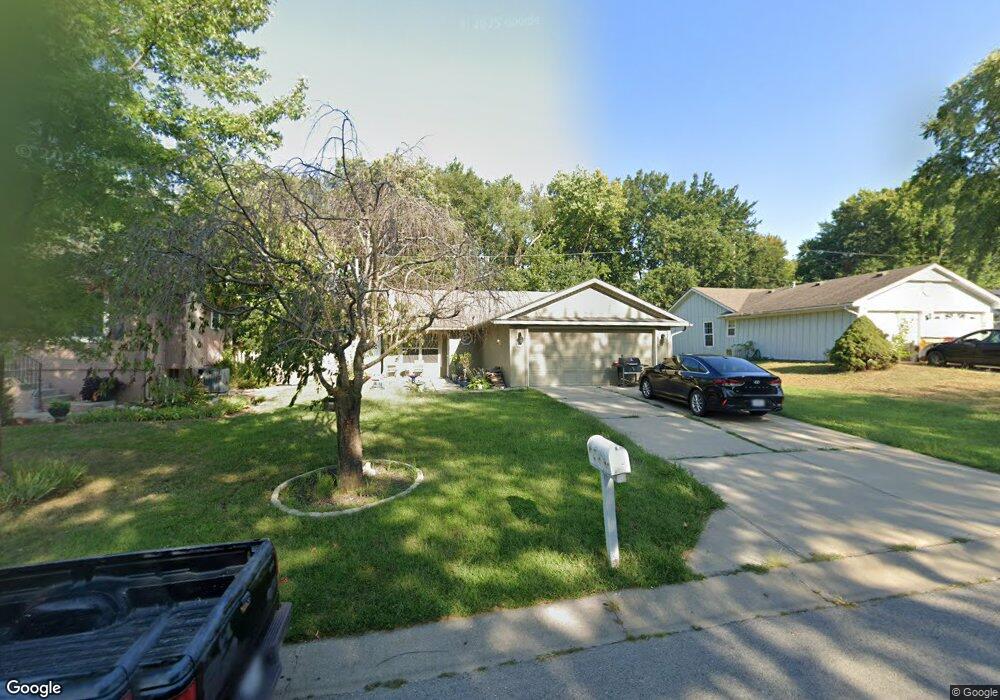
1613 N Lazy Branch Rd Independence, MO 64058
Estimated Value: $235,000 - $257,000
3
Beds
2
Baths
1,088
Sq Ft
$227/Sq Ft
Est. Value
About This Home
This home is located at 1613 N Lazy Branch Rd, Independence, MO 64058 and is currently estimated at $246,826, approximately $226 per square foot. 1613 N Lazy Branch Rd is a home located in Jackson County with nearby schools including Fort Osage High School.
Ownership History
Date
Name
Owned For
Owner Type
Purchase Details
Closed on
Sep 21, 2022
Sold by
Reynolds Charles S and Reynolds Louise A
Bought by
Reynolds Charles S and Perdue Thomas W
Current Estimated Value
Home Financials for this Owner
Home Financials are based on the most recent Mortgage that was taken out on this home.
Original Mortgage
$102,500
Outstanding Balance
$98,026
Interest Rate
5.55%
Mortgage Type
New Conventional
Estimated Equity
$148,800
Purchase Details
Closed on
Jul 30, 1996
Sold by
Paul Ford Construction Inc
Bought by
Reynolds Charles S and Reynolds Louise A
Home Financials for this Owner
Home Financials are based on the most recent Mortgage that was taken out on this home.
Original Mortgage
$76,950
Interest Rate
8.33%
Mortgage Type
Purchase Money Mortgage
Create a Home Valuation Report for This Property
The Home Valuation Report is an in-depth analysis detailing your home's value as well as a comparison with similar homes in the area
Home Values in the Area
Average Home Value in this Area
Purchase History
| Date | Buyer | Sale Price | Title Company |
|---|---|---|---|
| Reynolds Charles S | -- | None Listed On Document | |
| Reynolds Charles S | -- | Realty Title Company |
Source: Public Records
Mortgage History
| Date | Status | Borrower | Loan Amount |
|---|---|---|---|
| Open | Reynolds Charles S | $102,500 | |
| Previous Owner | Reynolds Charles S | $76,950 |
Source: Public Records
Tax History Compared to Growth
Tax History
| Year | Tax Paid | Tax Assessment Tax Assessment Total Assessment is a certain percentage of the fair market value that is determined by local assessors to be the total taxable value of land and additions on the property. | Land | Improvement |
|---|---|---|---|---|
| 2025 | $3,340 | $36,685 | $5,863 | $30,822 |
| 2024 | $3,340 | $37,343 | $3,217 | $34,126 |
| 2023 | $3,310 | $37,343 | $5,343 | $32,000 |
| 2022 | $2,595 | $27,740 | $4,266 | $23,474 |
| 2021 | $2,598 | $27,740 | $4,266 | $23,474 |
| 2020 | $2,391 | $25,162 | $4,266 | $20,896 |
| 2019 | $2,343 | $25,162 | $4,266 | $20,896 |
| 2018 | $2,016 | $21,563 | $2,740 | $18,823 |
| 2017 | $1,689 | $21,563 | $2,740 | $18,823 |
| 2016 | $1,689 | $19,574 | $2,990 | $16,584 |
| 2014 | $1,664 | $19,190 | $2,932 | $16,258 |
Source: Public Records
Map
Nearby Homes
- 18901 E Lynchburg Place N
- 1713 N Arapaho Ct
- 1511 Osage Trail
- 18104 E 17th St N
- 18108 E Shoshone Dr
- 2006 N Concord Rd
- 19204 E 15th St N
- 2015 N Lazy Branch Rd
- 17800 E Whitney Rd
- 19117 E 14th St N
- 18729 E 13th Terrace Ct N
- 0 E 24 Highway Cir
- 19201 E 13th Terrace N
- 2100 N York St
- 2023 N Ethan Ln
- 19704 E 14th Terrace N
- 1620 N Belvidere Ave
- 19706 E 20th St N
- 1124 N Ponca Dr
- 19706 E 14th St N
- 1611 N Lazy Branch Rd
- 1701 N Lazy Branch Rd
- 1703 N Lazy Branch Rd
- 1700 S Concord Ct
- 1610 S Concord Ct
- 1610 N Lazy Branch Rd
- 1702 S Concord Ct
- 1700 N Lazy Branch Rd
- 1702 N Lazy Branch Rd
- 1607 N Lazy Branch Rd
- 1608 N Lazy Branch Rd
- 1608 S Concord Ct
- 1704 S Concord Ct
- 1606 N Lazy Branch Rd
- 1704 N Lazy Branch Rd
- 1606 S Concord Ct
- 1605 N Lazy Branch Rd
- 1707 N Lazy Branch Rd
- 1706 N Lazy Branch Rd
- 1604 S Concord Ct