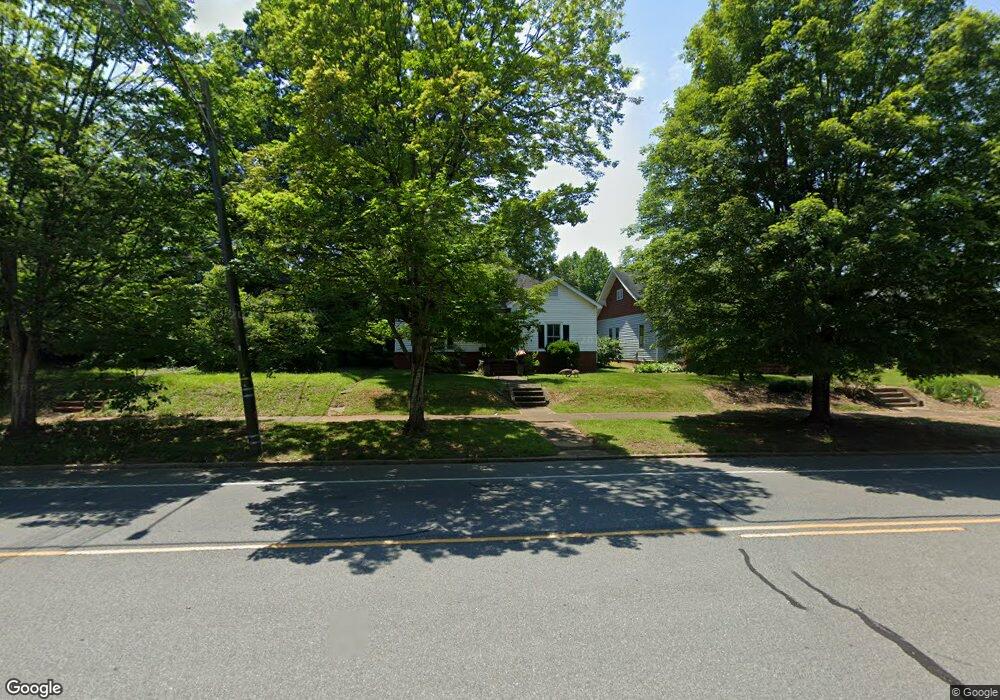
1613 N Main St Salisbury, NC 28144
Estimated Value: $143,000 - $204,000
--
Bed
1
Bath
1,536
Sq Ft
$112/Sq Ft
Est. Value
About This Home
This home is located at 1613 N Main St, Salisbury, NC 28144 and is currently estimated at $171,766, approximately $111 per square foot. 1613 N Main St is a home located in Rowan County with nearby schools including Carroll T Overton Elementary School, Knox Middle School, and North Rowan Middle School.
Ownership History
Date
Name
Owned For
Owner Type
Purchase Details
Closed on
Sep 30, 2005
Sold by
Finger Jon R and Finger Kristie
Bought by
Jemerson Arthur and Jemerson Edna
Current Estimated Value
Home Financials for this Owner
Home Financials are based on the most recent Mortgage that was taken out on this home.
Original Mortgage
$57,600
Outstanding Balance
$34,064
Interest Rate
7.47%
Mortgage Type
Fannie Mae Freddie Mac
Estimated Equity
$137,702
Create a Home Valuation Report for This Property
The Home Valuation Report is an in-depth analysis detailing your home's value as well as a comparison with similar homes in the area
Home Values in the Area
Average Home Value in this Area
Purchase History
| Date | Buyer | Sale Price | Title Company |
|---|---|---|---|
| Jemerson Arthur | $72,000 | Atlantis Title Co |
Source: Public Records
Mortgage History
| Date | Status | Borrower | Loan Amount |
|---|---|---|---|
| Open | Jemerson Arthur | $57,600 |
Source: Public Records
Tax History Compared to Growth
Tax History
| Year | Tax Paid | Tax Assessment Tax Assessment Total Assessment is a certain percentage of the fair market value that is determined by local assessors to be the total taxable value of land and additions on the property. | Land | Improvement |
|---|---|---|---|---|
| 2025 | $1,478 | $123,567 | $17,713 | $105,854 |
| 2024 | $1,478 | $123,567 | $17,713 | $105,854 |
| 2023 | $1,478 | $123,567 | $17,713 | $105,854 |
| 2022 | $1,044 | $75,775 | $13,625 | $62,150 |
| 2021 | $1,044 | $75,775 | $13,625 | $62,150 |
| 2020 | $1,044 | $75,775 | $13,625 | $62,150 |
| 2019 | $1,044 | $75,775 | $13,625 | $62,150 |
| 2018 | $849 | $62,521 | $13,625 | $48,896 |
| 2017 | $845 | $62,521 | $13,625 | $48,896 |
| 2016 | $822 | $62,521 | $13,625 | $48,896 |
| 2015 | $827 | $62,521 | $13,625 | $48,896 |
| 2014 | $833 | $63,709 | $12,807 | $50,902 |
Source: Public Records
Map
Nearby Homes