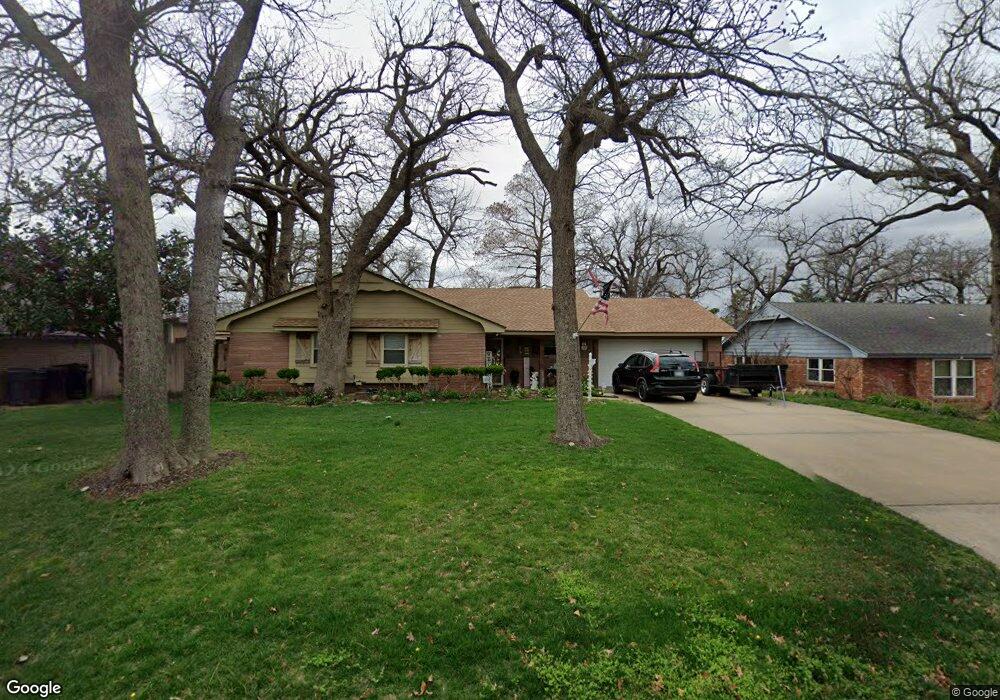
1613 N Markwell Place Oklahoma City, OK 73127
WesTen NeighborhoodEstimated Value: $204,555 - $233,000
3
Beds
2
Baths
1,617
Sq Ft
$134/Sq Ft
Est. Value
About This Home
This home is located at 1613 N Markwell Place, Oklahoma City, OK 73127 and is currently estimated at $216,139, approximately $133 per square foot. 1613 N Markwell Place is a home located in Oklahoma County with nearby schools including Lake Park Elementary School, Western Oaks Middle School, and Putnam City West High School.
Ownership History
Date
Name
Owned For
Owner Type
Purchase Details
Closed on
Jul 2, 2024
Sold by
Killgo Wanda and Hofacer Hugh
Bought by
Hofacer Hugh and Hofacer Wanda
Current Estimated Value
Home Financials for this Owner
Home Financials are based on the most recent Mortgage that was taken out on this home.
Original Mortgage
$135,000
Outstanding Balance
$133,397
Interest Rate
7.02%
Mortgage Type
New Conventional
Estimated Equity
$82,742
Purchase Details
Closed on
Oct 22, 2003
Sold by
Hofacer Hugh
Bought by
Hofacer Hugh and Killgo Wanda
Home Financials for this Owner
Home Financials are based on the most recent Mortgage that was taken out on this home.
Original Mortgage
$113,400
Interest Rate
7.25%
Mortgage Type
Purchase Money Mortgage
Purchase Details
Closed on
May 8, 2002
Sold by
Rollins Ralph D and Rollins Amy M
Bought by
Hofacer Hugh
Create a Home Valuation Report for This Property
The Home Valuation Report is an in-depth analysis detailing your home's value as well as a comparison with similar homes in the area
Home Values in the Area
Average Home Value in this Area
Purchase History
| Date | Buyer | Sale Price | Title Company |
|---|---|---|---|
| Hofacer Hugh | -- | American Eagle Title Group | |
| Hofacer Hugh | -- | Titleone | |
| Hofacer Hugh | $108,500 | Stewart Abstract & Title |
Source: Public Records
Mortgage History
| Date | Status | Borrower | Loan Amount |
|---|---|---|---|
| Open | Hofacer Hugh | $135,000 | |
| Previous Owner | Hofacer Hugh | $113,400 |
Source: Public Records
Tax History Compared to Growth
Tax History
| Year | Tax Paid | Tax Assessment Tax Assessment Total Assessment is a certain percentage of the fair market value that is determined by local assessors to be the total taxable value of land and additions on the property. | Land | Improvement |
|---|---|---|---|---|
| 2024 | $1,592 | $14,482 | $2,245 | $12,237 |
| 2023 | $1,592 | $14,061 | $2,238 | $11,823 |
| 2022 | $1,561 | $13,651 | $2,377 | $11,274 |
| 2021 | $1,498 | $13,254 | $2,761 | $10,493 |
| 2020 | $1,444 | $12,868 | $2,737 | $10,131 |
| 2019 | $1,378 | $12,494 | $2,728 | $9,766 |
| 2018 | $1,336 | $12,130 | $0 | $0 |
| 2017 | $1,296 | $11,776 | $2,747 | $9,029 |
| 2016 | $1,252 | $11,433 | $2,435 | $8,998 |
| 2015 | $1,227 | $11,100 | $2,636 | $8,464 |
| 2014 | $1,357 | $12,615 | $2,636 | $9,979 |
Source: Public Records
Map
Nearby Homes
- 1601 N Markwell Place
- 1516 N Markwell Place
- 8029 NW 15th St
- 8004 NW 20th St
- 2121 N Markwell Ave
- 1413 Mary Ave
- 10501 NW 10th St
- 2312 Overholser Ct
- 8300 NW 10th St Unit 32
- 8017 NW 8th Terrace Unit 196
- 8213 NW 25th St
- 1540 Bradley Place
- 7609 NW 14th St
- 10352 NW 17th St
- 1721 N Alexander Ln
- 1712 N Alexander Ln
- 7818 NW 8th St
- 7529 NW 11th St
- 8008 NW 27th St
- 7815 NW 6th St
- 1609 N Markwell Place
- 1617 N Markwell Place
- 1612 N Markwell Ave
- 1608 N Markwell Ave
- 1616 N Markwell Ave
- 1605 N Markwell Place
- 1612 N Markwell Place
- 1604 N Markwell Ave
- 1616 N Markwell Place
- 1608 N Markwell Place
- 1600 N Markwell Ave
- 1604 N Markwell Place
- 8145 NW 16th St
- 1613 N Markwell Ave
- 1617 N Markwell Ave
- 1517 N Markwell Place
- 8125 NW 16th St
- 1605 N Markwell Ave
- 1613 N Mcmillan Ave
- 1621 N Mcmillan Ave